Avoid enormous network payloads is a Lighthouse audit that refers to the total size of your frontend files transferred over the network. To pass the audit, you need to keep this number below a certain threshold.
On modern websites and web applications, network payloads tend to grow fast. As a huge payload can be caused by various things, you'll need to implement a comprehensive web performance optimization workflow, including identifying your unique issues, visualizing HTML and CSS files, compressing and minifying files, reducing font and image weight, and more.
In this article, we'll look into this workflow in detail — but first, let's see what network payloads are exactly and when they become "enormous".
What Is a Network Payload?
Your network payload is the sum of all files (a.k.a. resources) your page downloads from your own or third-party servers over the internet.
This includes:
- HTML files
- CSS files
- JavaScript files
- image files
- video files
- font files
- etc.
Lighthouse defines network payloads as "roughly equivalent to 'resources'" in a source code comment of its Total Byte Weight script. Apart from that, I couldn't find another definition of 'network payload' in Google's documentation.
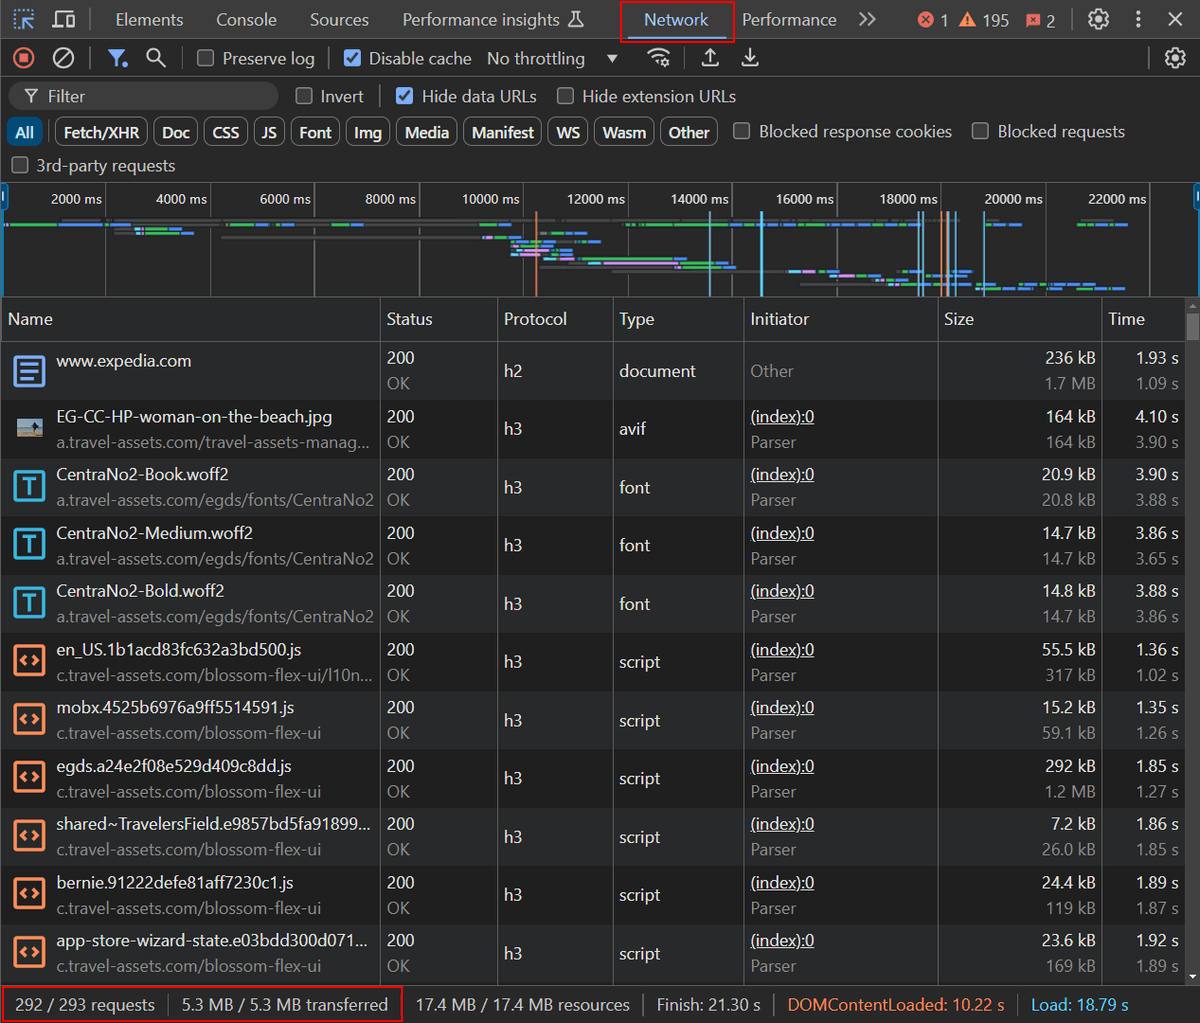
You can check the list of your resources in the Network tab of Chrome DevTools. Each resource takes one network request.
Below, you can see the list of network requests on Expedia's homepage (the network payload consists of 293 files and weights 5.3 MB):
This network payload triggers the yellow flag in Lighthouse, which means there's room for improvement:
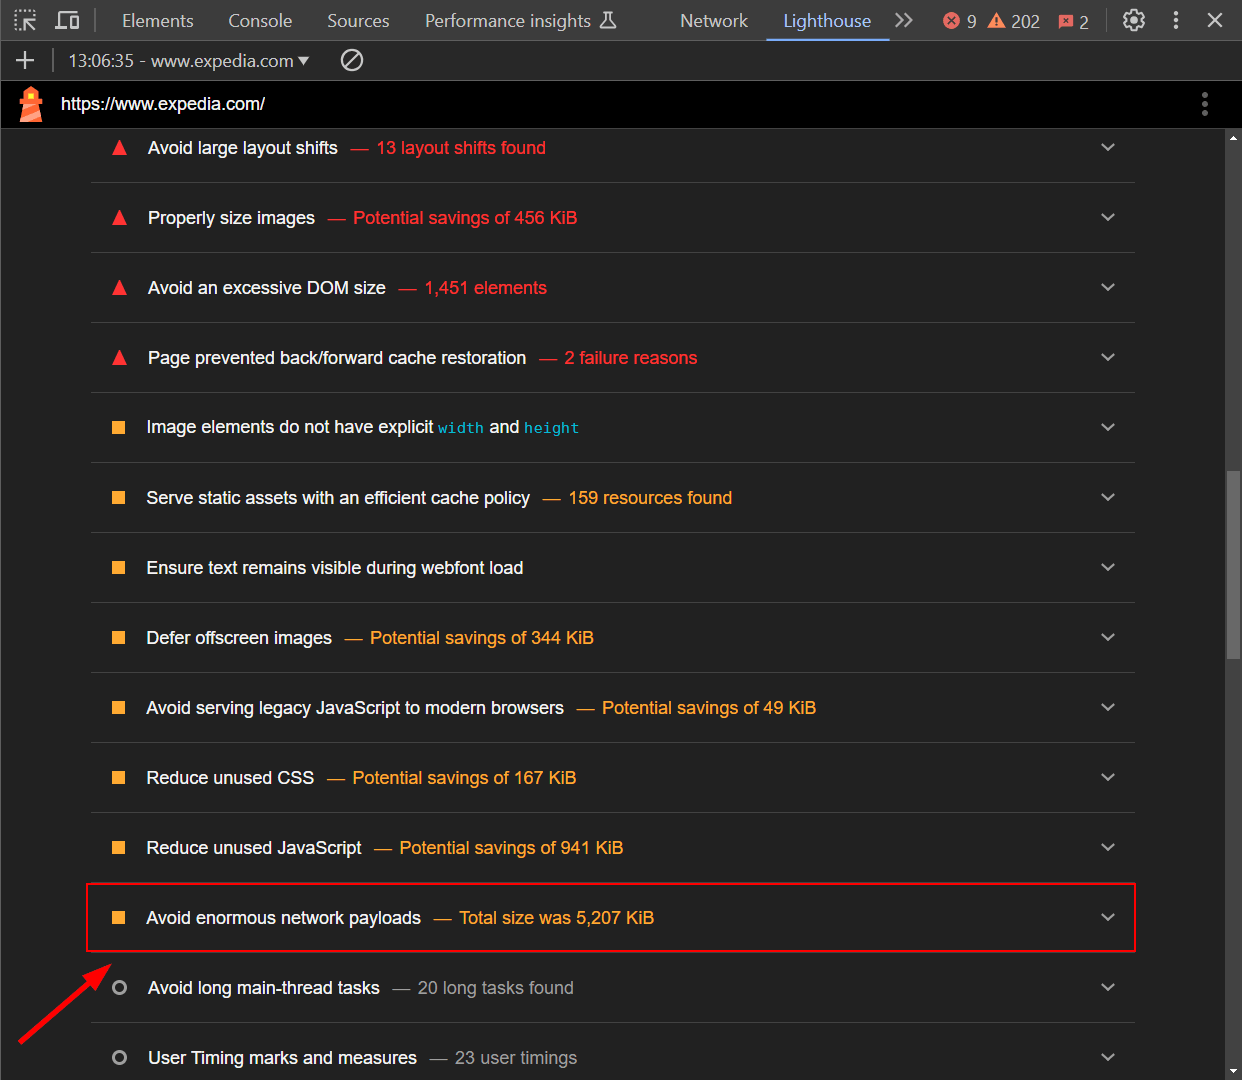
To avoid enormous network payloads, you need to reduce the total size of your resources. You can accomplish this in three ways:
- Removing resources you don't need that much.
- Reducing the download size of your resources.
- Downloading resources only shortly before the user needs them (i.e. lazy loading them).
The screenshots above show the initial network payload, which is also what the Lighthouse report records. However, this number can go up while the user is interacting with the page, as the browser may request new resources to respond to those user actions.
When Do Network Payloads Become "Enormous"?
Lighthouse's documentation provides the following information about when network payloads qualify as "enormous":
"Based on HTTP Archive data, the median network payload is between 1,700 and 1,900 KiB. To help surface the highest payloads, Lighthouse flags pages whose total network requests exceed 5,000 KiB."
However, this information was last updated in 2019 (approximately 5.5 years before the time of writing of this article). In my tests on real-world websites, Lighthouse reports showed different results. It's also worth noting that I couldn't find a more recent official resource on the exact thresholds.
Based on my own tests, the findings of other articles on the topic, and Lighthouse's source code, it seems that the yellow flag is triggered when the network payload is higher than 2667 KB.
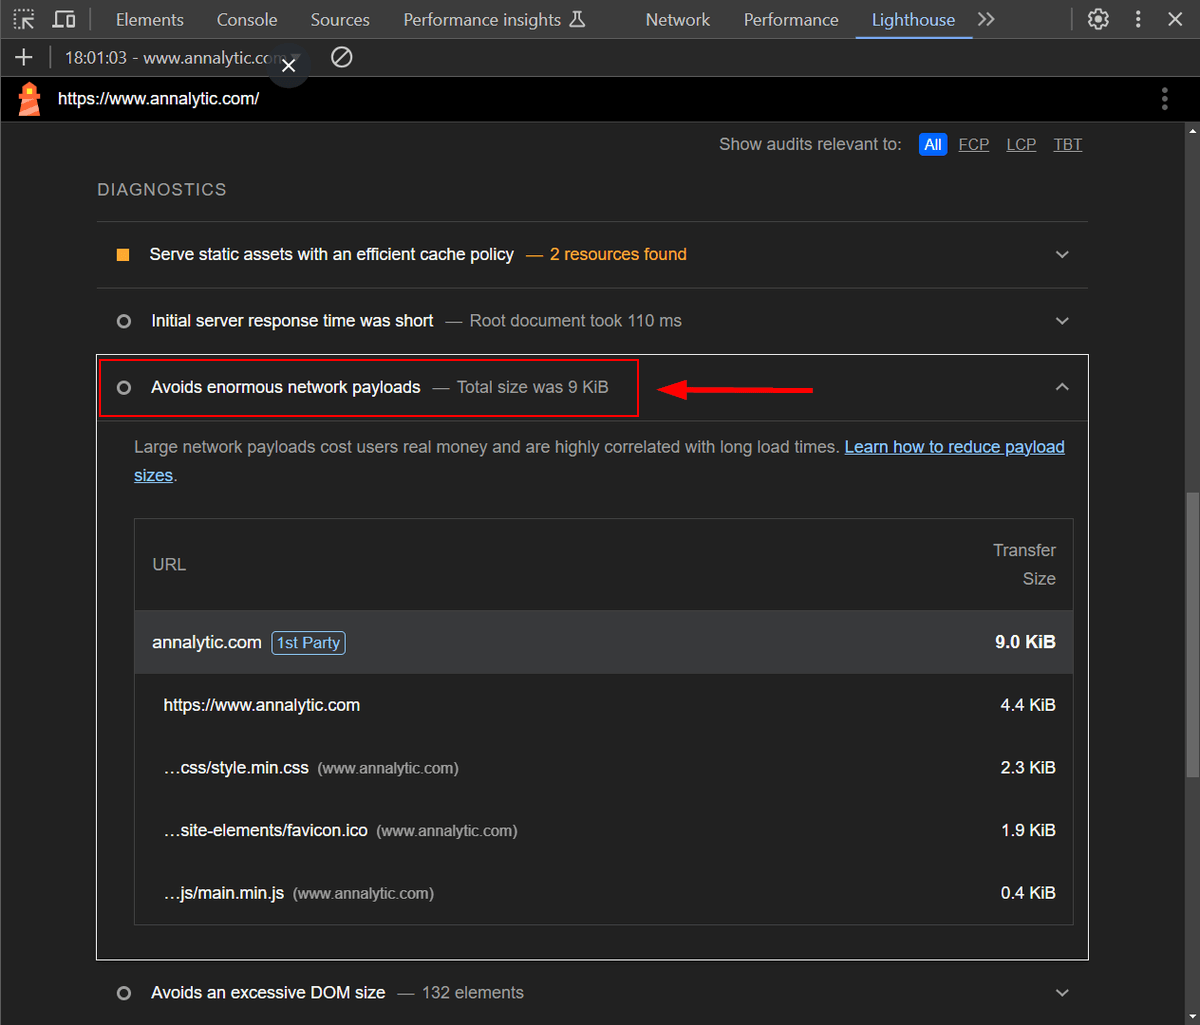
Curiously, the Avoid Enormous Network Payloads audit never triggers the green flag. Even when the network payload is really very low, Lighthouse still shows the grey (info) flag.
For example, in the screenshot below, you can see that while I passed the audit, I still couldn't get into the Passed Audits section for my personal website, which has a very lightweight network payload (i.e. 9 KB):
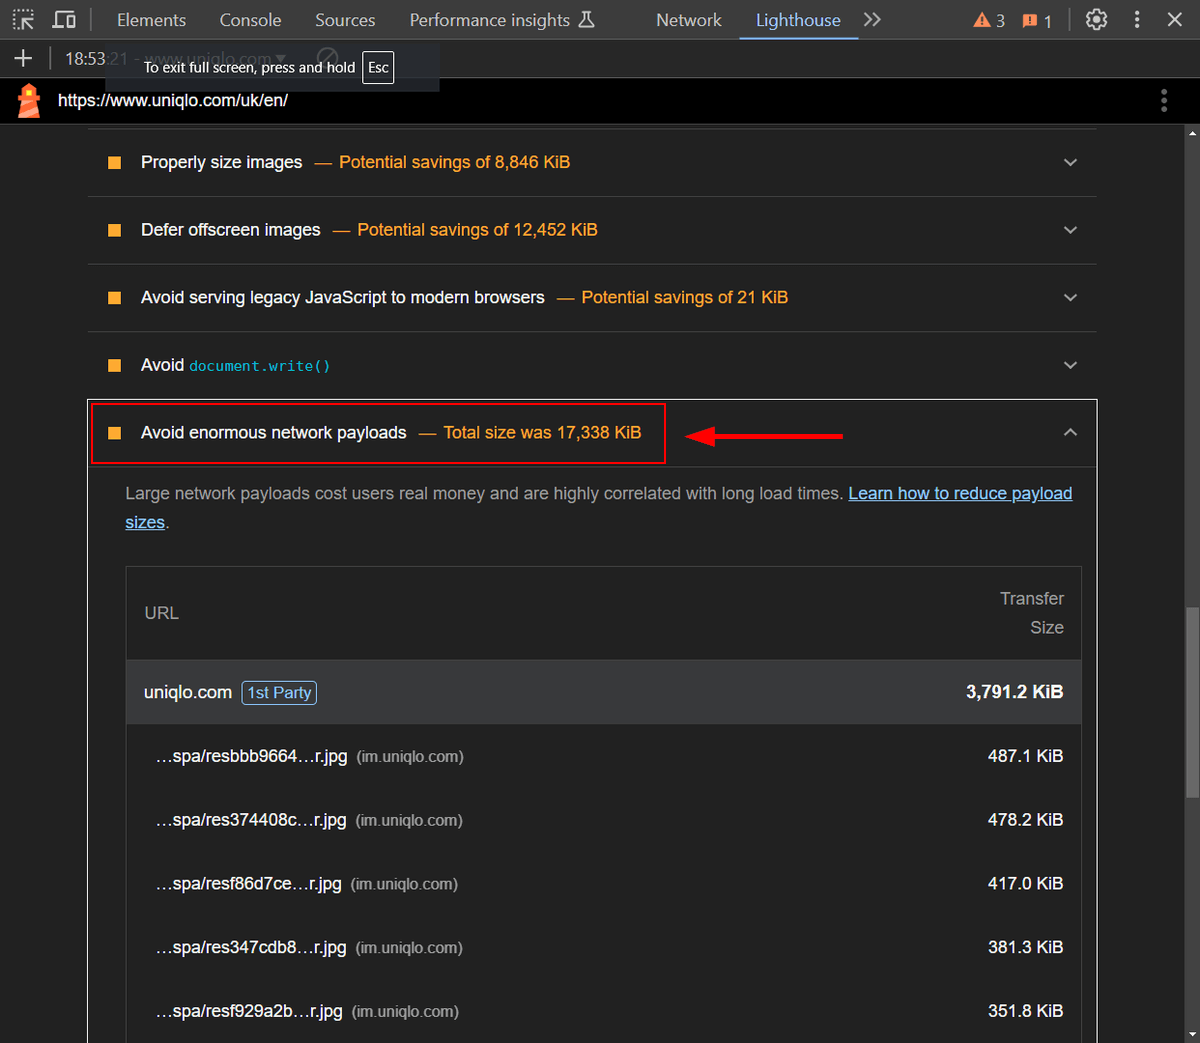
Even more curiously, it also seems that the Avoid Enormous Network Payloads audit never triggers the red flag.
In the screenshot below, you can also see a yellow flag for Uniqlo's homepage, which has an extremely enormous network payload (i.e. 17,338 KB):
Based on the above empirical testing, it can be assumed that you'll get either the grey or yellow flag for the Avoid Enormous Network Payloads audit, and the threshold between the two is 2,667 KB. Simply put, grey means success while yellow means failure — so you'll need to aim for the grey one.
Why Avoid Enormous Network Payloads?
A heavy network payload hurts web performance because your page will load slower and, in some cases, it will also cause unexpected layout shifts.
It may increase any of the three Core Web Vitals:
- Largest Contentful Paint (LCP) because it takes longer for the above-of-fold content to appear on the screen.
- Interaction to Next Paint (INP) because the JavaScript downloads and compiles later.
- Cumulative Layout Shift (CLS) because if the browser has to download and process more files, it's more likely that the different layout elements will appear on the screen in a non-linear way, which will cause more unexpected layout shifts.
All in all, network payload is a metric that impacts basically every other performance score.
Most likely, this is also why Avoid Enormous Network Payloads never gets the green flag in Lighthouse, as this is something you can never be completely happy about — even if your page just weighs 9 KB.
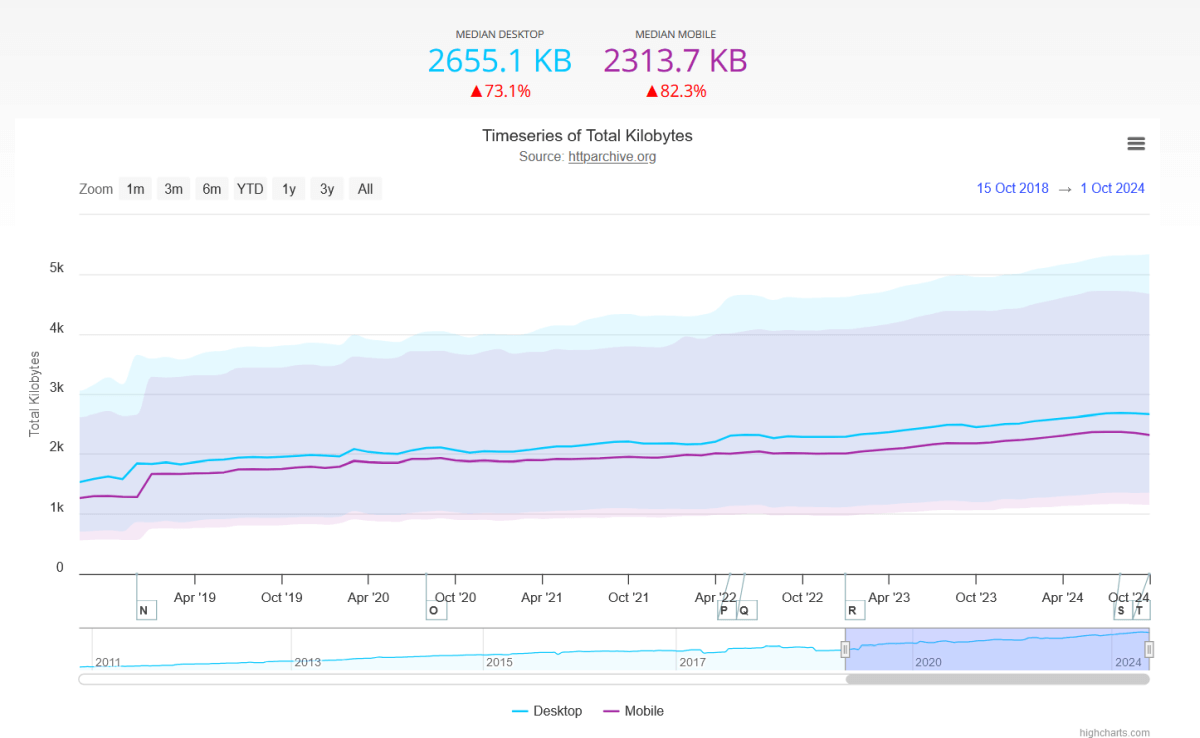
Despite the importance of the metric, network payload has consistently kept growing since the CrUX Report started to collect web performance data.
As HTTP Archive's Total Kilobytes report shows, the median page weight increased by 73.1% on desktop and 82.3% on mobile between October 2018 and October 2024:
Now, let's see the 10 steps that can help you avoid enormous network payloads.
1. Analyze Your Network Payload
The first step is to analyze your network payload so you can find ways to reduce its size. You can start with a Lighthouse report to check whether you pass or fail the Avoid Enormous Network Payloads audit and get a high-level overview of the structure of your network payload.
For more fine-grained insights, you can use a more advanced web performance analysis tool, such as DebugBear. For example, you can run a free site speed test that includes a visualized request waterfall chart that shows all the resources the browser downloads at initial page load.
In the screenshot below, you can see the request waterfall for Expedia's homepage on mobile, tested from our US Central data center:
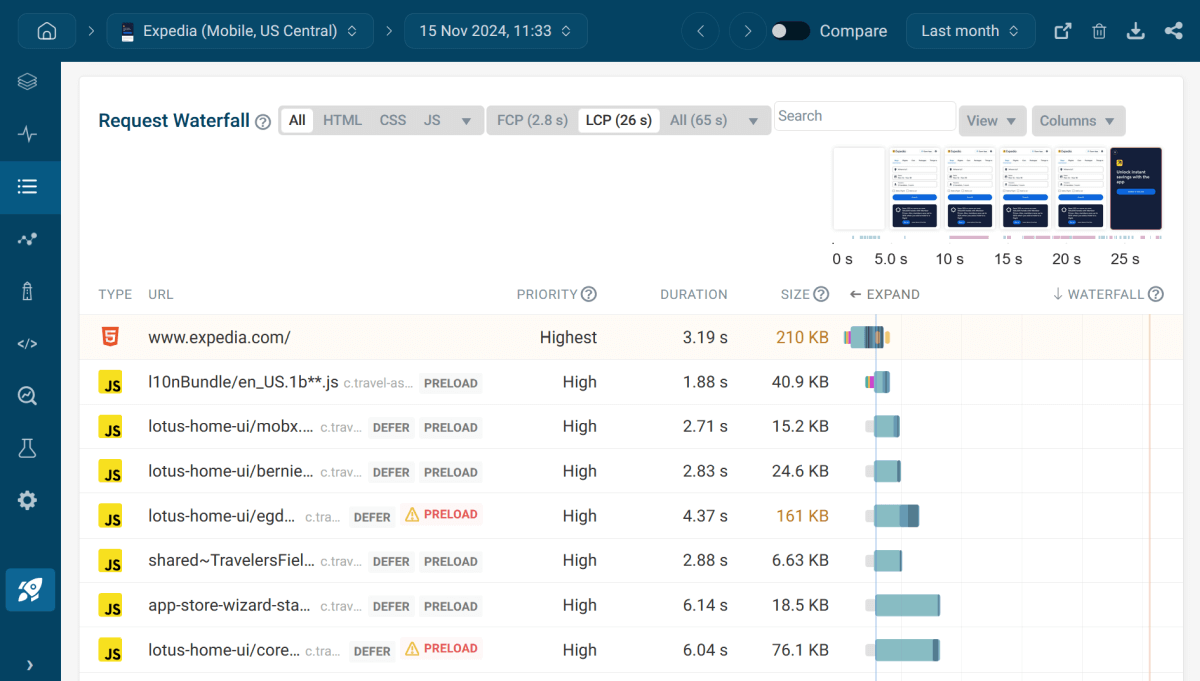
The request waterfall tells a lot about the structure of your network payload, including the size, priority, and duration of each network request. By getting a detailed list of your resources, you can start thinking about which ones you can remove, refactor, replace, or defer.
DebugBear's request waterfall chart allows you to:
- sort your resources by request priority, duration, size, and download order
- review the third-party domains the browser connects to
- filter the resources by file type (e.g. HTML, CSS, scripts, images, fonts, etc.)
- inspect the details of each HTTP request, such as the headers, body, request chain, and others
- ... and more
on a per-page basis.
2. Reduce the Download Size of Your HTML Page
The main HTML file tends to be one of the largest resources on most web pages. For example, if we sort the network requests on Expedia's homepage by size (see the above screenshot), it's the biggest file at 210 KB.
However, is 210 KB really too large?
If you can't decide, DebugBear has an audit that tells you whether you should reduce the download size of your HTML file (the download size is the file size after HTTP text compression — we'll look into this web performance optimization technique in Step 4).
DebugBear has its own audits called Recommendations that provide more nuanced information about your web performance issues than the standard Lighthouse audits. You can access both from DebugBear's interface:
- The LH audits are available from the Lighthouse menu.
- The DebugBear recommendations are available from the Overview menu.
As you can see below, Expedia's homepage doesn't pass DebugBear's Reduce HTML download size audit, which means we need to dig deeper.
To do so, I opened the recommendation and used the built-in HTML size analysis tool available from the expanded accordion:
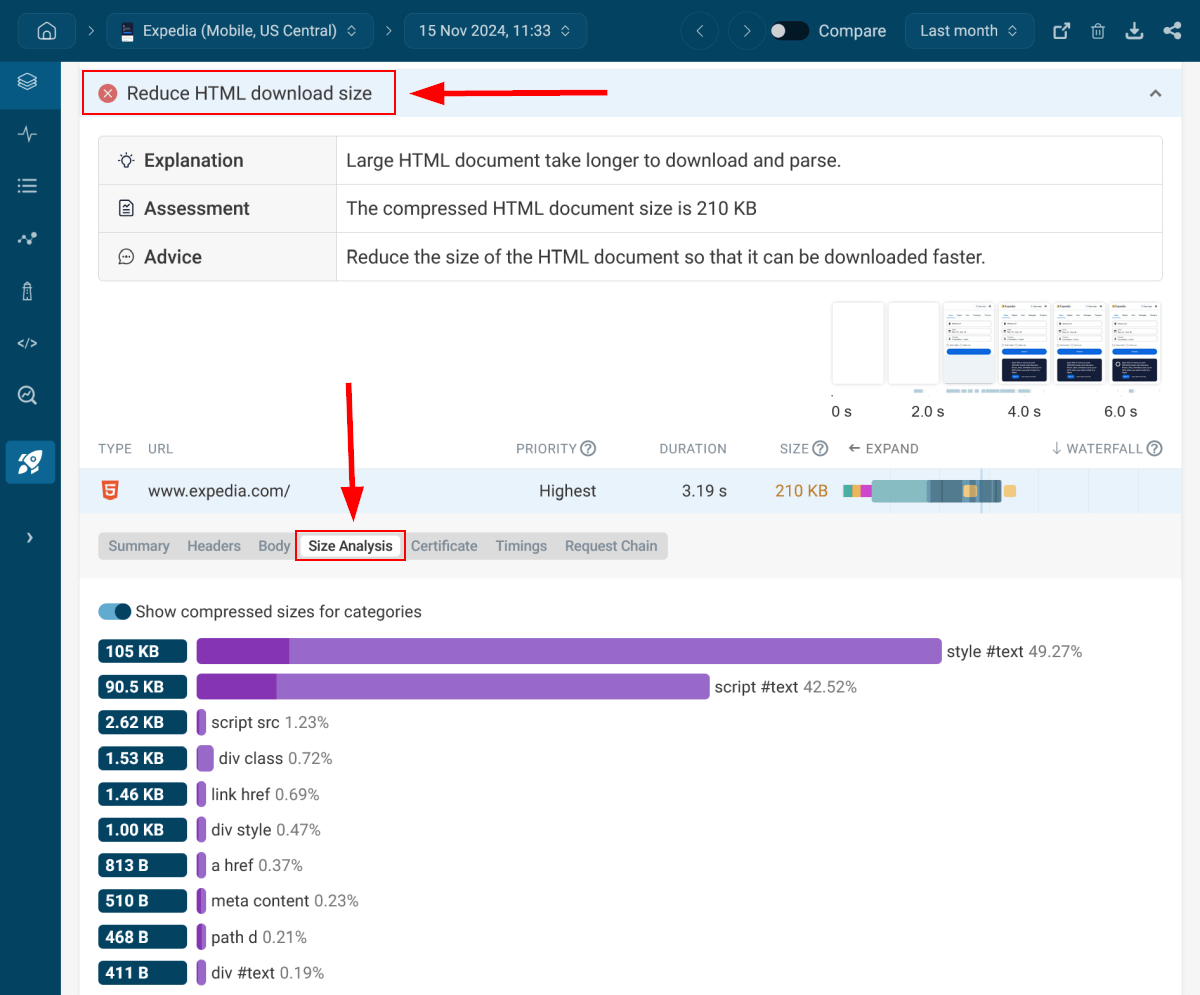
As the size analysis above shows, the large HTML download size is caused by two types of elements on Expedia's homepage:
- inline styles (
style #text) - inline scripts (
script #text)
To investigate the culprits further, you can expand each category to see a list of the belonging HTML elements, sorted by size.
At this point, you could start finding ways to optimize the elements that cause the excessive HTML download size, e.g. by moving the inline styles and scripts into external files — which, of course, may cause different issues that trigger other warnings, but with web performance optimization, the goal is always to find the most optimal trade-off.
DebugBear's HTML Size Analyzer is also available as a separate web app you can use for free.
The HTML Size Analyzer is one of our free site speed tools.
3. Avoid Large CSS Files
After checking and, if necessary, reducing the HTML download size, the next step to fix the Avoid enormous network payloads Lighthouse warning is to analyze the sizes of your CSS files.
While there's only one HTML file on most web pages (except if there are iframes on the page, which embed other HTML files into the main HTML document), it can load multiple CSS files both from your own and third-party domains.
CSS files often include superfluous elements you can get rid of without changing the functionality. For example, you can simplify too long CSS selectors, remove unused style rules, replace images and fonts embedded with Base64 encoding with external files, and others.
To learn more about why and how to reduce CSS page weight, read our article on optimizing CSS for speed.
To help you measure the sizes of your CSS files and refactor them if necessary, DebugBear has an Avoid large CSS files recommendation, which comes with a built-in CSS size analyzer tool that works similarly to the aforementioned HTML size analyzer.
In the screenshot below, you can see that Booking.com's homepage received an info flag for this recommendation on mobile, which means that while there aren't any huge problems, there's still room for improvement:
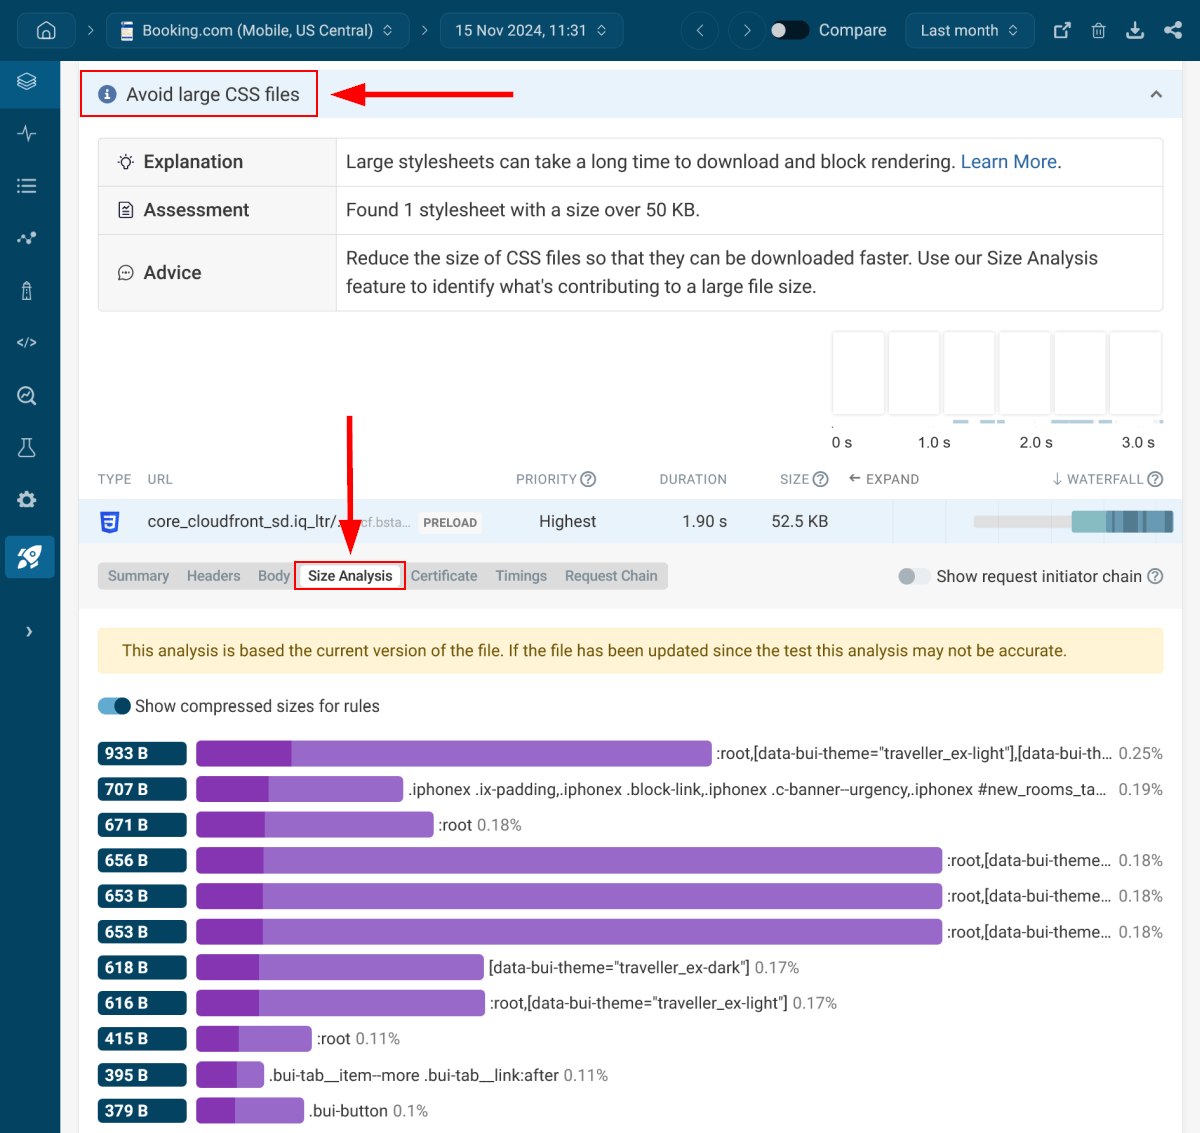
As DebugBear's above assessment shows, there's one large CSS file with a size over 50 KB — their core CSS file. This is not a bad result since Booking.com loads 42 CSS files on mobile (most coming from code splitting, which is a web performance optimization technique that allows you to load resources in chunks, only on the pages where they are used).
However, it would still be possible to reduce its size using the aforementioned refactoring techniques. For example, it includes very long variable names, which are then used to define other variables with similarly long names, such as:
--bui_animation_page_transition_enter: var(
    --bui_animation_page_transition_enter_duration
  ) var(--bui_animation_page_transition_enter_timing_function);
While descriptive variable names can help code readability, they can also contribute to an enormous network payload, especially if the variables are frequently used in the code.
DebugBear's CSS Size Analyzer is also available as a separate web app you can use for free.
It's another one of our free site speed tools.
4. Compress Your Text Files
Compressing text files (e.g. HTML, CSS, JavaScript, JSON, etc.) on the server is the next step to fix the Avoid enormous network payloads warning.
While these days, most web hosts use HTTP text compression by default to make websites load faster, different compression algorithms compress text files with different efficiency, so it may be worth choosing a host that uses a more modern algorithm.
The three most modern (i.e. efficient) text compression algorithms are GZIP, Brotli, and Zstandard, each having different compression levels:
- GZIP has nine compression levels between GZIP 1 and GZIP 9 – GZIP is supported in effectively all browsers.
- Brotli has 11 compression levels between Brotli 1 and Brotli 11 – Global browser support for Brotli is 97.65% as of the time of writing.
- Zstandard has 29 compression levels between Zstandard -7 and Zstandard 22 (there are just positive and negative levels, but there's no Zstandard 0) – Global browser support for Zstandard is 70.41% as of the time of writing (Safari doesn't support it).
Lower compression levels (e.g. GZIP 1, Brotli 1, Zstandard -7) compress text files faster but with a lower efficiency while higher compression levels (e.g. GZIP 9, Brotli 11, Zstandard 22) have a higher compression ratio, but need more CPU time.
In the chart below, you can see the efficiency of the three HTTP text compression algorithms at various compression levels:
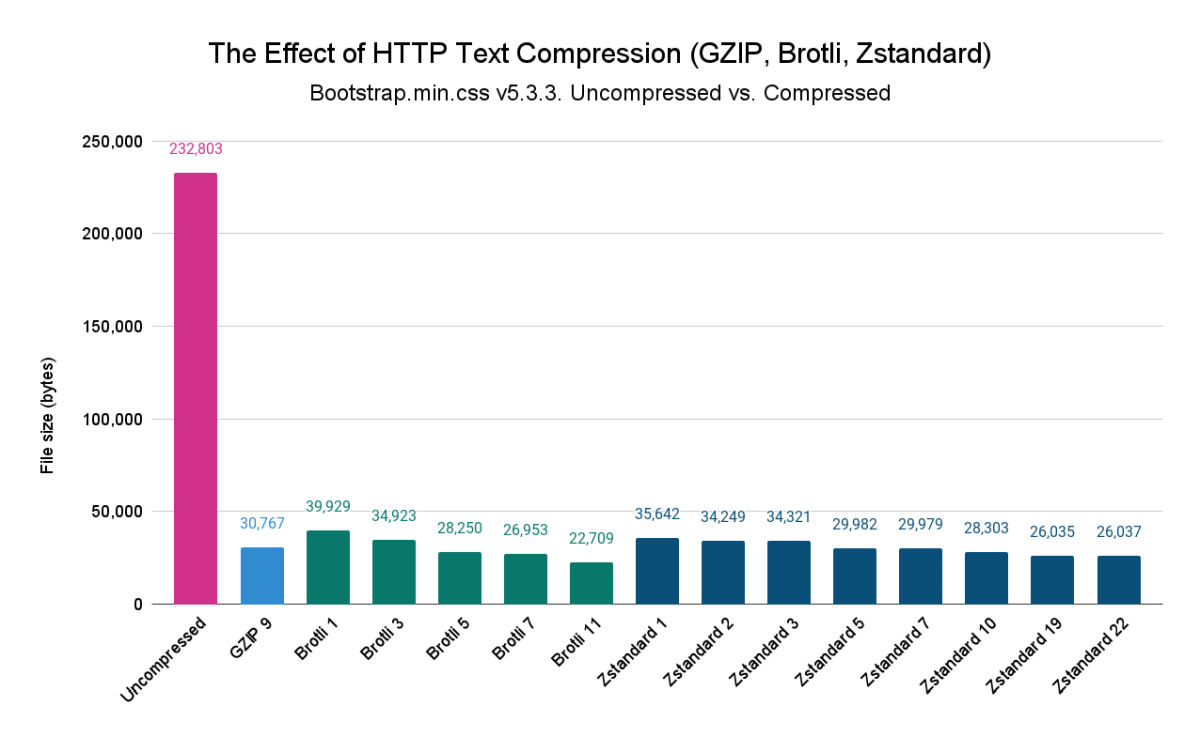
For our returning readers: The data I used for the above chart is identical to the one used in my Shared Compression Dictionaries article, but here, the chart only includes the without-dictionary results.
To see the HTTP compression algorithm each of your resources uses, you can check DebugBear's Compress text files recommendation, which will show you a list of all the files your page loads along with the used text compression algorithm.
In the screenshot below, you can see that Booking.com's homepage uses Brotli encoding for most of its text files:
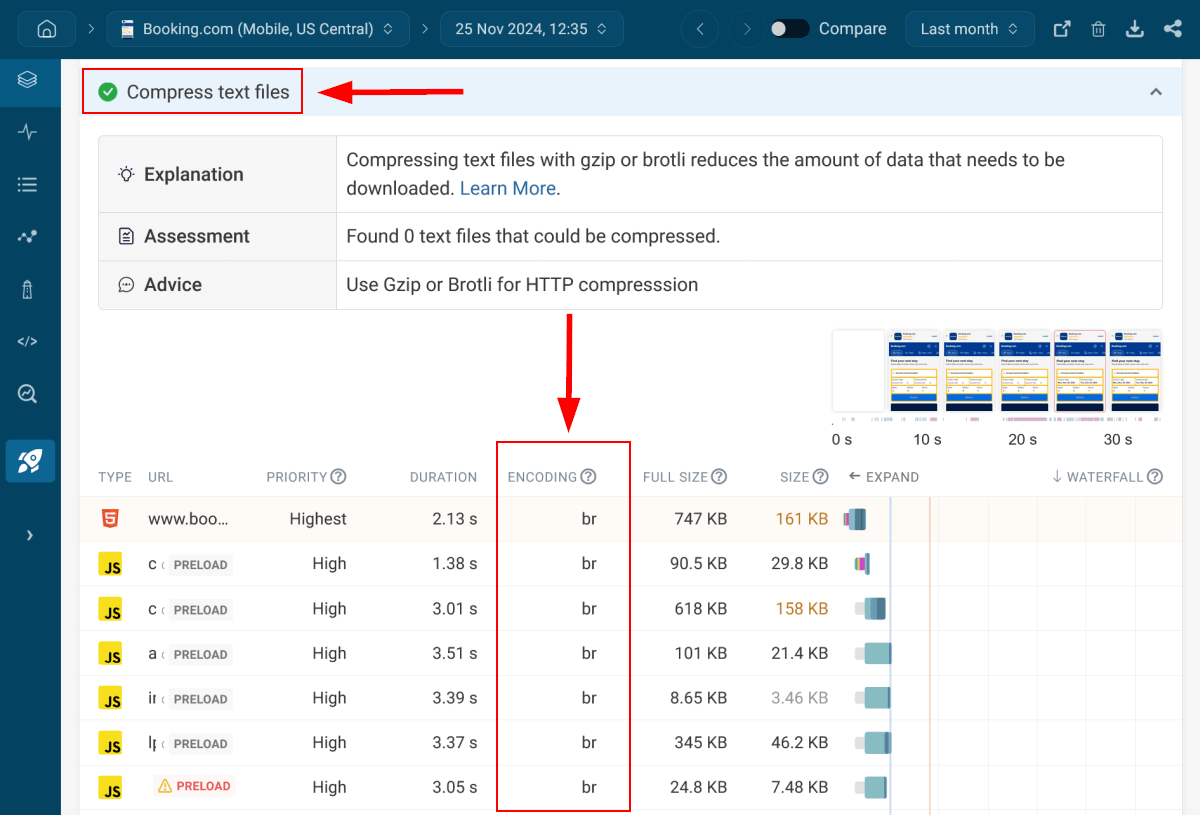
The Compress text files recommendation also gives you a hint if there are any text files on the page that could still be compressed.
To learn more about HTTP text compression algorithms, read our articles on:
- How to improve page speed with GZIP or Brotli
- What are shared compression dictionaries – Compression dictionaries can significantly improve compression ratios and reduce network payloads for subsequent visits; you can use them with either the Brotli or Zstandard algorithm.
5. Minify Your HTML, CSS, and JavaScript Files
In addition to compressing your text files, you can also minify your HTML, CSS, and JavaScript resources. By using both compression and minification, you can achieve an overall file size reduction of up to 90% (see our calculations).
Minification and compression are not the same thing. If you want to use both, you'll need to minify your text files before compressing them.
The following comparison table shows the main differences between compression and minification:
| Compression | Minification | |
|---|---|---|
| What does it do? | It encodes text files using a compression algorithm such as GZIP, Brotli, or Zstandard. These algorithms replace common strings with tokens so the compressed file becomes (much) smaller in size. | It minifies text files by removing unnecessary white space, line breaks, semicolons, code comments, etc. |
| Where is it performed? | The file is encoded on the server, then it's decoded on the browser. The browser and server negotiate the supported compression algorithms using the Accept-Encoding and Content-Encoding HTTP headers. | The file is minified during the build process, or if there's no build process, before the file is uploaded to the server. The browser can read and process the minified file without decoding or any other steps. |
| The output | Non-human-readable files. The file extension changes to .gz, .br, .zst, etc., but the encoder usually keeps the original extension in the file name, e.g. .html.gz, .css.br, .js.zst. | Human-readable files. The file extension doesn't change, but the common practice is to add .min before the file extension to indicate that it's a minified file, e.g. .min.html, .min.css, .min.js. |
| Tools | GZIP, Brotli, Zstandard, etc. encoder (running on the server) + GZIP, Brotli, Zstandard, etc. decoder (running in the browser) | Module bundlers (e.g. Webpack, Rollup, Parcel) or, if there's no build process, standalone code minifiers (e.g. HTML minifier, CSS Minify, Minifier.org) |
| Code example | G8MAAETd1uqH7vTZki+2CyoWEWJ28wKlWnRL8kDaC/z2D/ZID3XDpKTMf8ObWB4nHaaOiV5IhxumqFHOYwD0WCgZwXPz0e3LyNhspfCF9vmf+Y6BA38N7lDhAw== | .btn.active,.btn.show,.btn:first-child:active,:not(.btn-check)+.btn:active{color:var(--bs-btn-active-color);background-color:var(--bs-btn-active-bg);border-color:var(--bs-btn-active-border-color)} |
The code example above is taken from the Bootstrap library's minified CSS file. The compressed version is the same string compressed with the Brotli algorithm using Facia.dev's online Brotli Compress tool.
As you can see above, the compressed string is somewhat shorter — its size shrank from 196 bytes to 124 bytes (the file size reduction is 36.73%). However, note that this is a very short string. For larger text files, the reduction is typically much bigger, as there are much more common strings the encoder can tokenize.
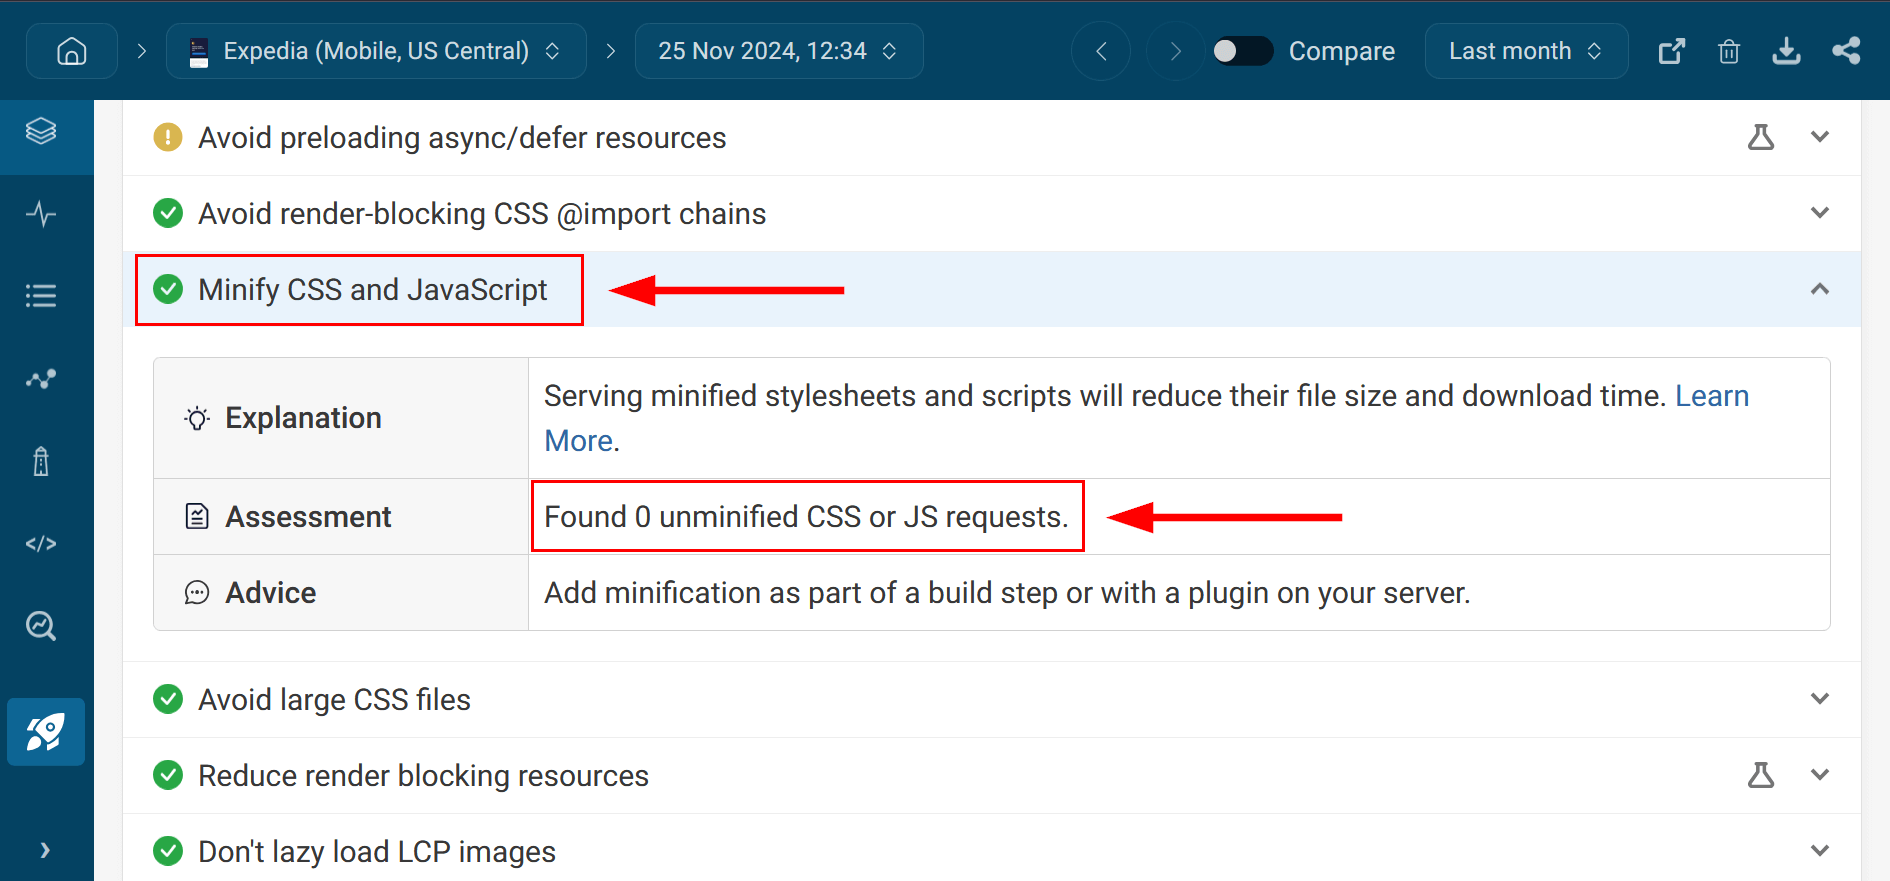
To find your CSS and JavaScript files that are not minified, you can make use of DebugBear's Minify CSS and JavaScript recommendation, which shows your unminified CSS and JavaScript requests, if you have any:
6. Reduce Unused CSS and JavaScript
While compressing and minifying your text files is an essential step to avoid enormous network payloads, there's another way to reduce page weight — by auditing your CSS and JavaScript files to identify and remove unused code.
This is something you'll only be able to do to your own resources (e.g. it's generally not recommended to refactor Bootstrap's CSS), but it can still help you fix the Avoid enormous network payloads Lighthouse warning.
However, there are other ways to reduce the weight of third-party stylesheets and scripts, e.g. by only downloading them on pages where they are used, which you can achieve by implementing code splitting, tree shaking, scope hoisting, and other loading features offered by module bundlers.
Since Reduce unused JavaScript is another Lighthouse audit, I recently posted about it in detail — you can read my How to Reduce Unused JavaScript article here. It shows a couple of methods you can use to detect and remove unused JavaScript (including the aforementioned module bundler features) — and while the post is about JavaScript, you can use the exact same methods to reduce unused CSS, too.
7. Optimize Image Weight
As images make up a huge part of page weight, optimizing their size and download strategy is an essential step in avoiding enormous network payloads.
The easiest way to go about image weight optimization is by using DebugBear's weight-related image recommendations:
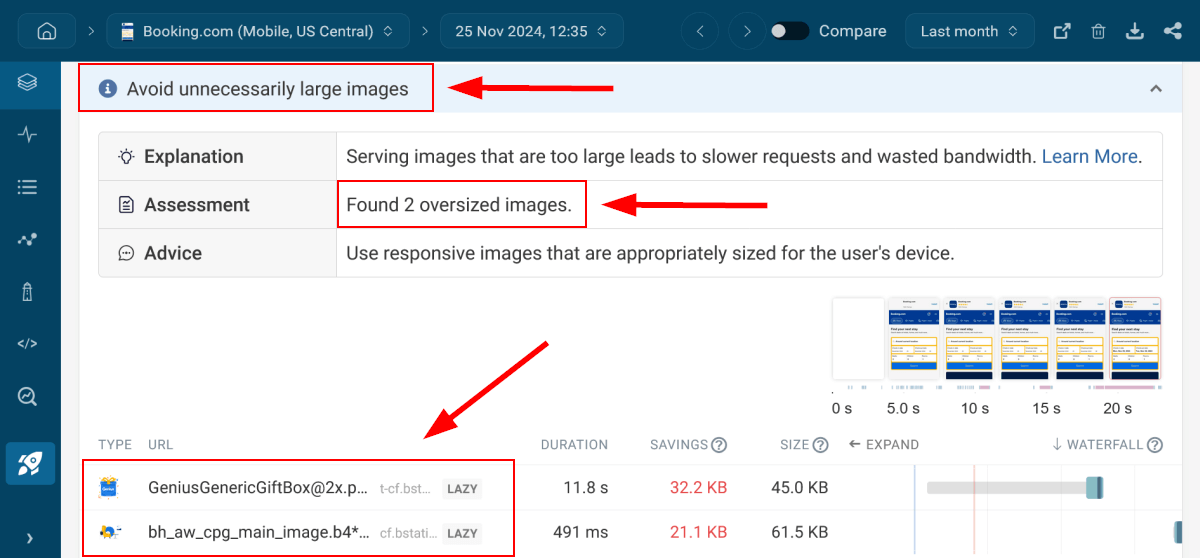
- Avoid unnecessarily large images – To pass this audit, implement a responsive image strategy, which provides the browser with a collection of images for the same location so it can choose the best-fitting one (e.g. the most lightweight image that still doesn't get blurred). For more information, take a look at my Ulitmate Guide to Responsive Images on the Web article, which includes many hands-on examples and code snippets.
- Lazy load offscreen images – By deferring offscreen images and background images, you prevent browsers from downloading them for users who don't access the surrounding area on the page. To learn more, check out my How to Defer Offscreen Images and Background Images article, which explains both the
loadingHTML attribute and theIntersectionObserver APIwith practical examples. - Use modern image formats – Using next-gen images (i.e. WebP and AVIF) is another image weight optimization technique that can help you reduce your network payloads (browser support is already good — check out WebP support and AVIF support). For recommendations on how to choose the most performant file formats for your images, see my Modern Image Formats for the Web post.
In the screenshot below, you can see DebugBear's Avoid unnecessarily large images recommendation along with the list of the two oversized images it found on Booking.com's homepage on mobile:
8. Reduce Font Weight
While fonts don't weigh as much as images on most pages, downloading unnecessary or large web fonts can also contribute to excessive network payloads. So the next step in solving the Avoid enormous network payloads issue is optimizing font weight.
Here are the most important font weight optimization techniques, each of which can be implemented fairly easily (for code examples, recommendations, and tools check out my Ultimate Guide to Font Performance Optimization):
- If you don't need custom web fonts for the website design, use web-safe fonts that most users have installed on their machines as system fonts so the browser doesn't have to download the font files from the web.
- If you use web fonts, don't download more than two font families on a page.
- Compress your web fonts using WOFF2, the currently most performant font compression algorithm.
- Only download the character sets you want to use on the page (e.g. on an English-only website, you won't need the Greek character set).
- Set the
font-displayCSS property tofallbackoroptionalso the browser only downloads the custom web font on fast connections and devices (see font display strategies).
To see the number of web fonts a page downloads from the web, you can use the Fonts filter on DebugBear's request waterfall page (available from the Requests menu).
For example, Tripadvisor's homepage only downloads one custom web font in the compressed WOFF2 format on desktop, as measured from our US Central test location in Iowa:

9. Break Up Long Pages
You can also reduce your network payload by breaking up longer pages into shorter ones. You can start by auditing your website to find pages that can be split into two or three parts or made smaller in other ways (e.g. by removing sidebar widgets).
A shorter page typically means:
- a smaller HTML file
- fewer image and video files
- fewer scripts
- if you use code splitting, smaller CSS and JavaScript bundles
Breaking up long pages can also help you improve other Lighthouse audits, such as the Avoid an excessive DOM size warning.
10. Implement Browser Caching for Static Resources
The last step to fix the Avoid enormous network payloads warning is implementing an efficient cache policy.
There are different types of caching, such as browser caching, server caching, database caching, API caching, etc. To reduce your network payload, you'll need to implement browser caching, as it allows you to load some of your static resources, such as fonts, stylesheets, and scripts, from the browser cache for returning users, instead of requesting them from the server.
You can set up caching rules on your server — for example, in the .htaccess file on Apache or the nginx.conf file on NGINX.
If your website runs on a content management system such as WordPress, you can use a caching plugin, e.g. WP Fastest Cache or WP Rocket, which lets you handle caching without coding knowledge. Some web hosts also take care of caching, e.g. this is the case with most managed hosting plans.
To know whether your caching policy is efficient or not, you can make use of the Serve static assets with an efficient cache policy Lighthouse audit.
In the screenshot below, you can see that Booking.com's homepage didn't pass this audit and has 58 resources that could have a more efficient caching policy (which typically means a longer cache lifetime):
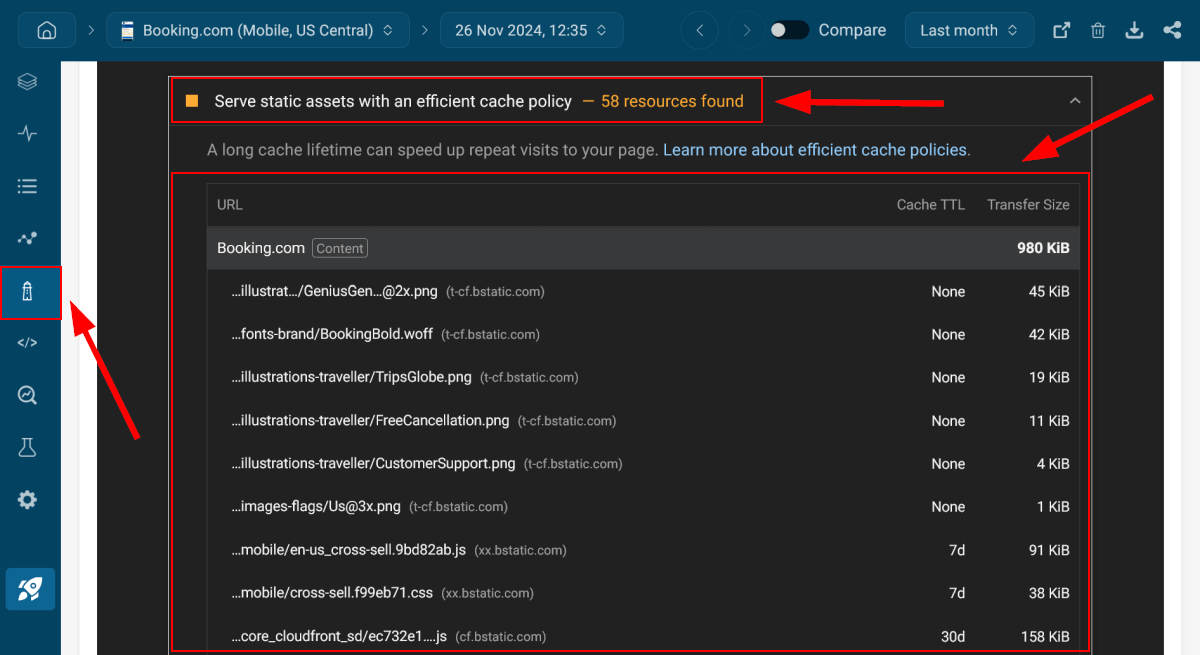
You can see all Lighthouse audits in DebugBear by clicking the Lighthouse menu in the left sidebar. We show these in addition to our own recommendations, which you can reach from the Overview menu.
Start Testing Your Pages for Enormous Network Payloads
To avoid enormous network payloads, it's essential to maintain good overall website health.
The easiest way to achieve this is by continuously monitoring your key pages, conducting both simulated and real user tests, and following web performance best practices and recommendations, e.g. the 10 steps of our comprehensive network payload optimization workflow discussed in this article.
You can do all this and more using DebugBear, which you can start using for free of charge. To do so, check out our interactive demo, run a website test using our free site speed tool, or sign up for a fully functional 14-day free trial (no credit card required).