In this article, we’ll explore why CPU throttling is a valuable tool for performance testing and examine the differences in how CPU throttling is applied across various tools.
Why throttle the CPU?
CPU throttling helps evaluate how websites perform on less powerful devices by reducing processing speeds. This technique mimics page loading on devices like older smartphones or budget-friendly computers.
When improving Core Web Vitals data for Google, we want to achieve good scores across the 75th percentile. Enabling CPU throttling lets us gain insight into the slowest percentiles in order to improve user experience for slower devices.
How to throttle the CPU in Chrome DevTools
To throttle the CPU in DevTools, open the Performance tab and click on the lower gear icon in the top right. You can then add throttling next to the CPU label.

There are currently four CPU throttling options:
- No throttling
- 4x slowdown
- 6x slowdown
- 20x slowdown
If a task normally takes 50 milliseconds on your computer, selecting 6x throttling means it will take 300 milliseconds with throttling enabled.
After selecting your configuration, hit the record and reload button to profile performance.

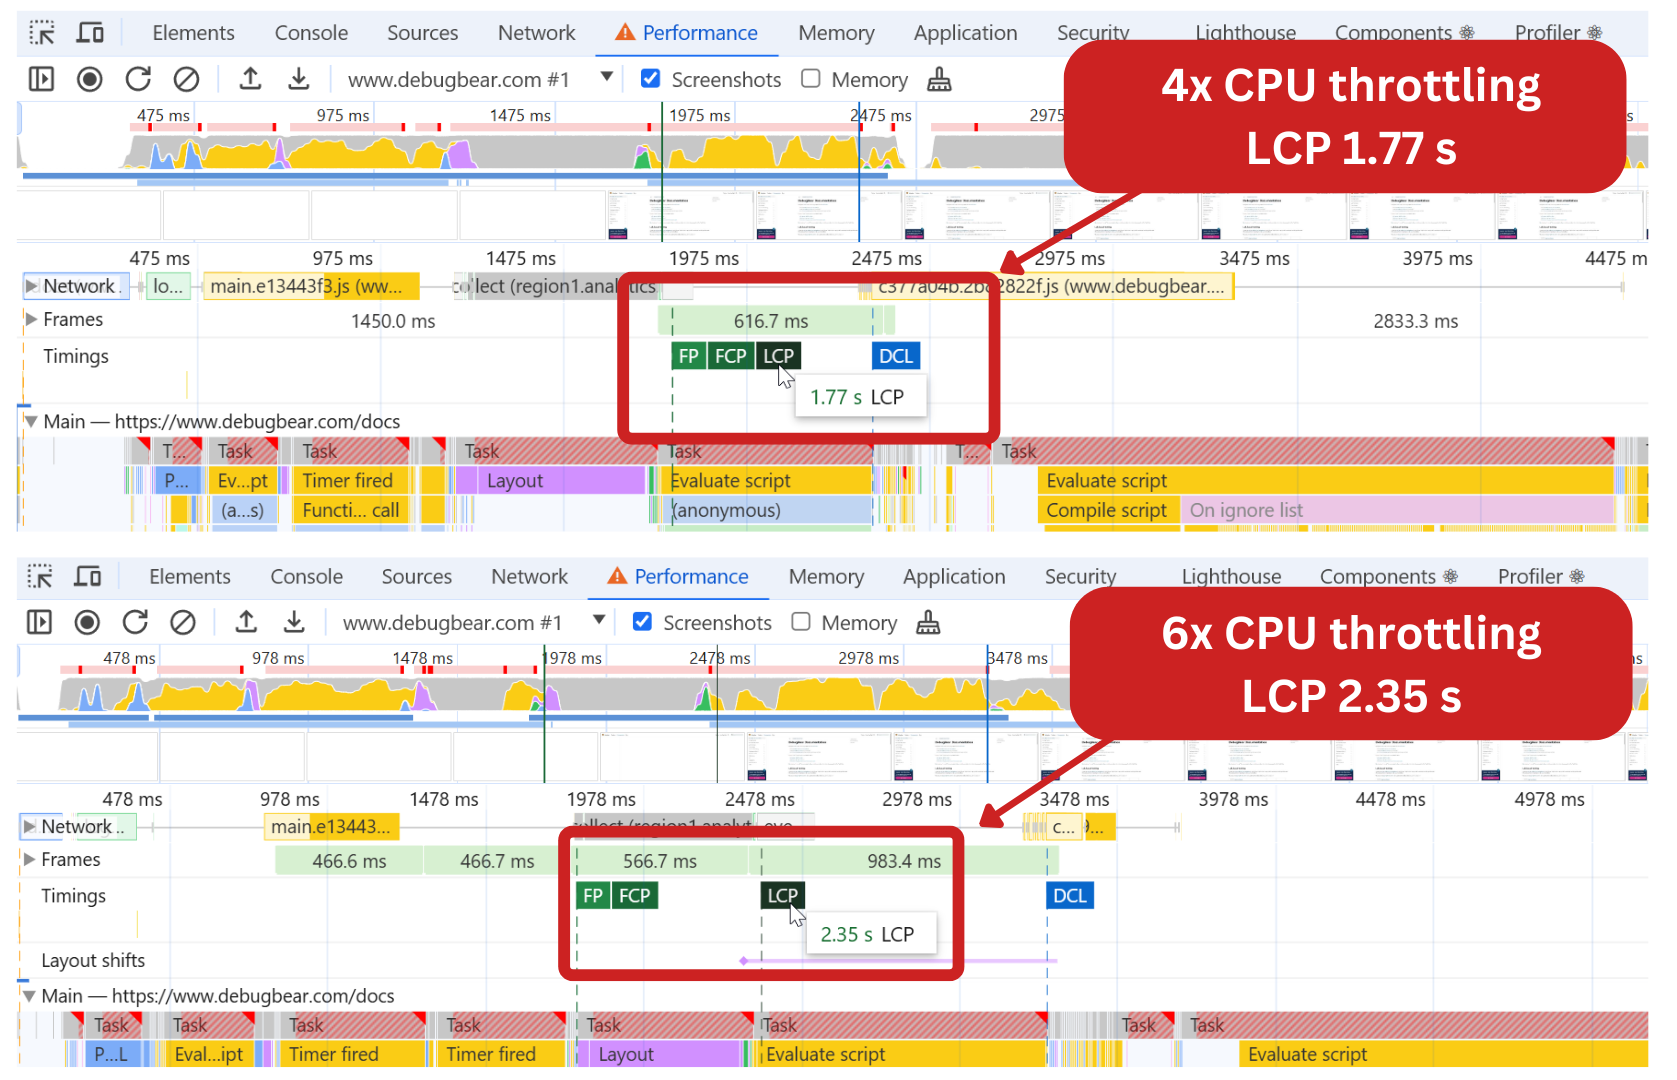
Results vary based on which multiplier is selected. Below we can see a difference from profiling the same page with 4x throttling compared to 6x throttling. We can see that LCP score increased by over 500 ms when throttling is increased.
This profile allows us to analyze what could speed up rendering the LCP element on slower devices.
Make sure to also enable device emulation
If you're trying to measure performance on a phone or tablet, make sure to also adjust the device size and enable touch interactions.
To do enable device emulation, click on the device icon in the top left corner of the DevTools panel.

CPU throttling on Page Speed Insights
Page Speed Insights throttles the CPU for its lab tests. This lab data is gathered in a controlled environment, loading your website from a Google server.
The key difference between DevTools and PageSpeed Insights is that Google uses simulated throttling for their test results. Each test collects data on a fast connection and the fastest CPU speed possible on the device.
The test results are presented as an estimation for slower devices. This technique provides quick and cost-effective testing for websites. However, the results can be less reliable since tests are not conducted on actual slower connections.
Since the PageSpeed Insights test environment is usually slower than a typical computer, PSI used to report worse scores than when testing locally in DevTools when using the default Lighthouse throttling setting of 4x.
Due to that PSI has changed its throttling from 4x to 1.2x in December 2024 to deliver results that better reflect real-world performance.

CPU throttling with Lighthouse
Running Lighthouse locally offers more control over testing to suit your needs. By default, Lighthouse applies a 4x CPU slowdown on mobile. On desktop no throttling is applied.
Configuring throttling with Lighthouse CLI
One of the benefits of running tests with Lighthouse CLI is the option to change the CPU multiplier. This can be achieved by changing the multiplier value of the command-line argument.
In the example below, we have changed the value to 6x CPU slowdown:
lighthouse https://example.com --throttling.cpuSlowdownMultiplier=6
Configure CPU throttling on DebugBear
With DebugBear lab tests, you can configure CPU throttling to match your needs. When adding a page, four default options are listed for selection:
- Desktop - 1x CPU throttling
- Desktop Fast - 1x CPU throttling
- Mobile - 4x CPU throttling
- Mobile Fast - 2x CPU throttling
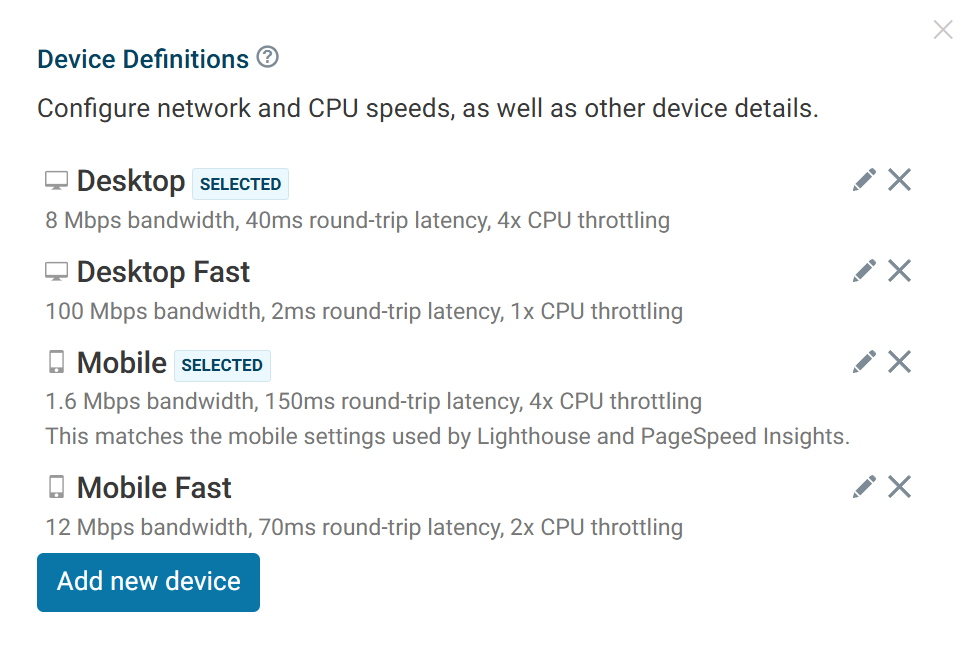
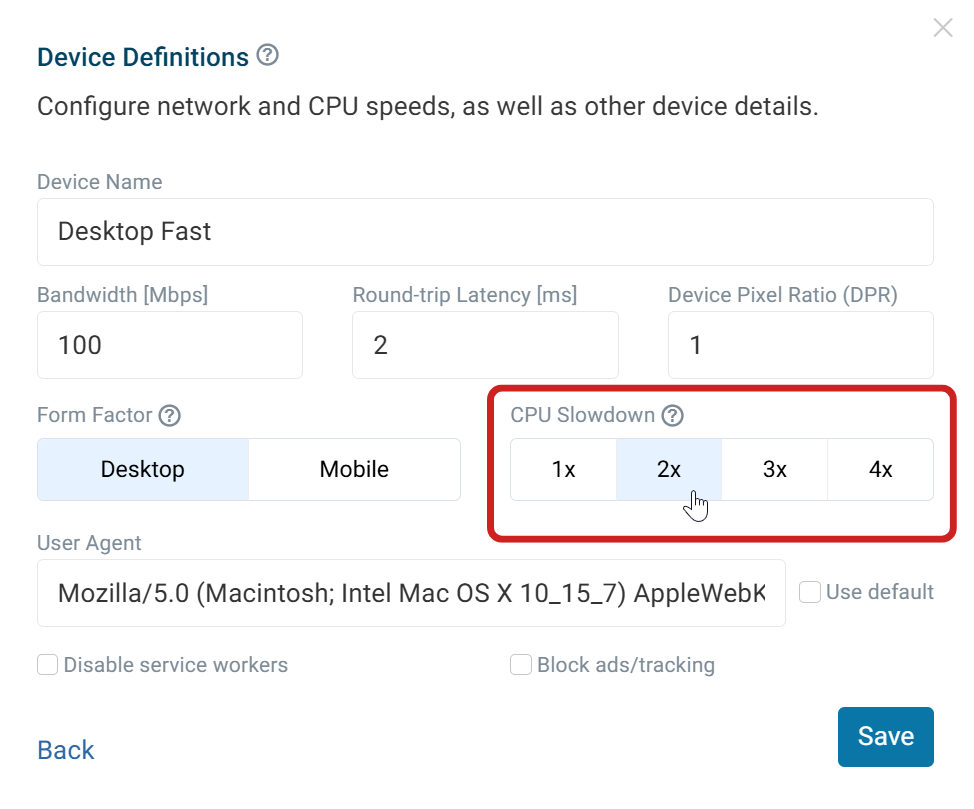
Each default option can be customized by clicking the pen icon. For example, Desktop Fast is selected here but modified to use 2x CPU throttling instead of the default 1x.
Monitor website CPU performance continuously
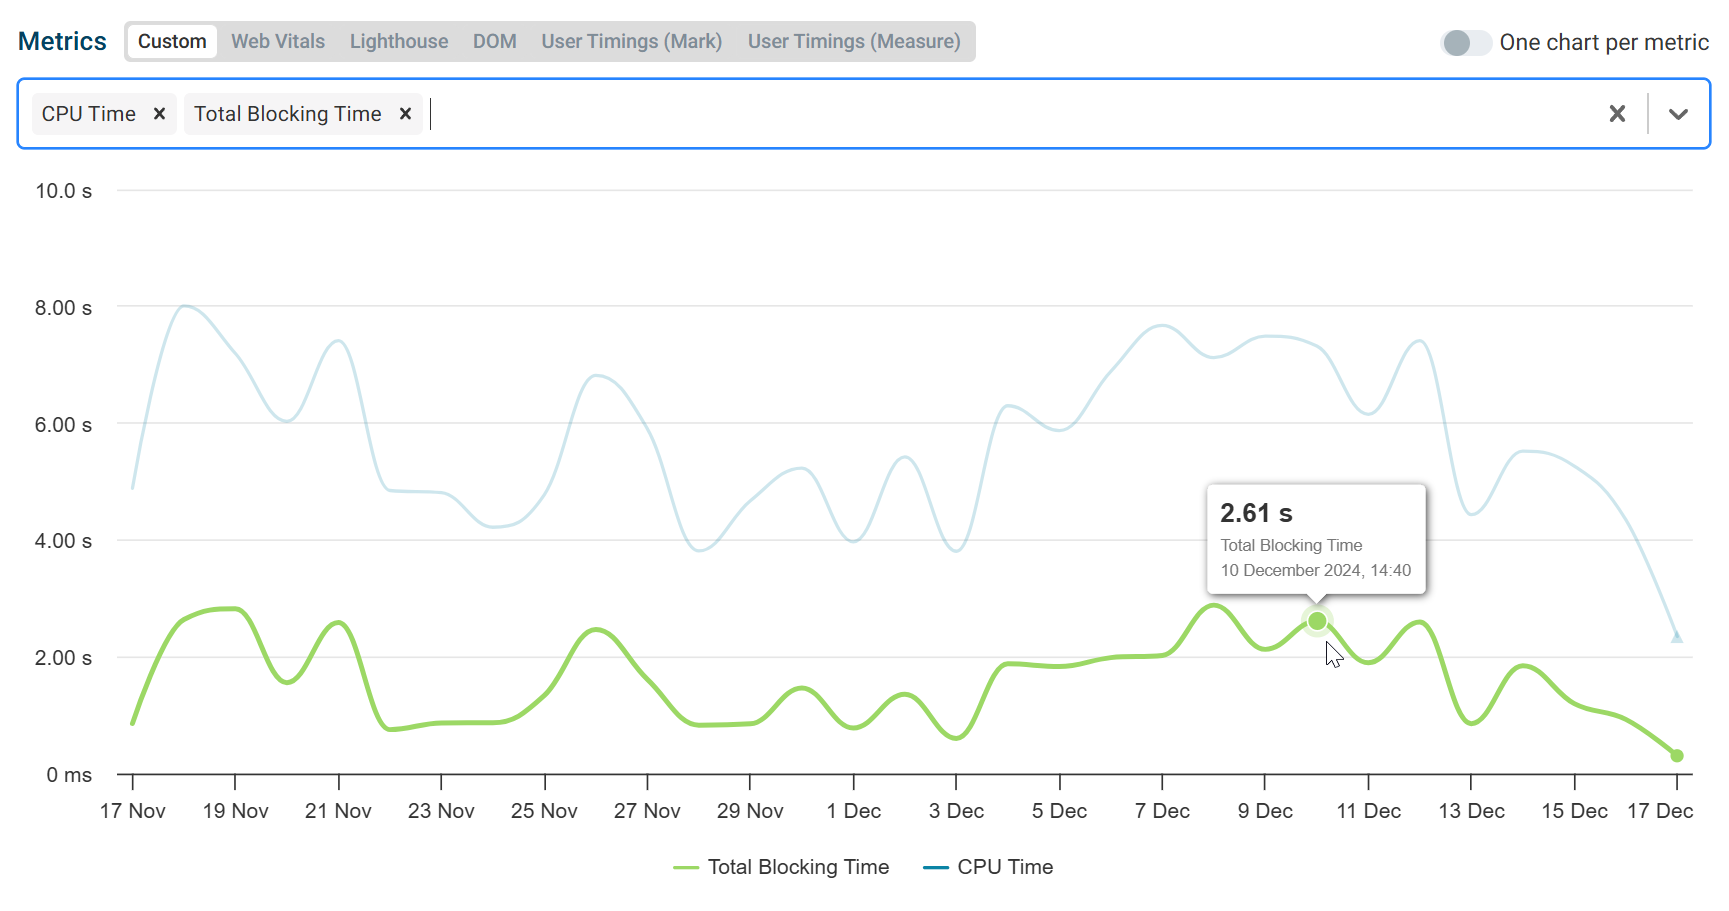
With DebugBear, you can monitor a page continuously to catch any regressions. CPU Time is included as one of the many metrics available. In the chart below, we can see CPU Time has improved in recent days after a spike in the week before.
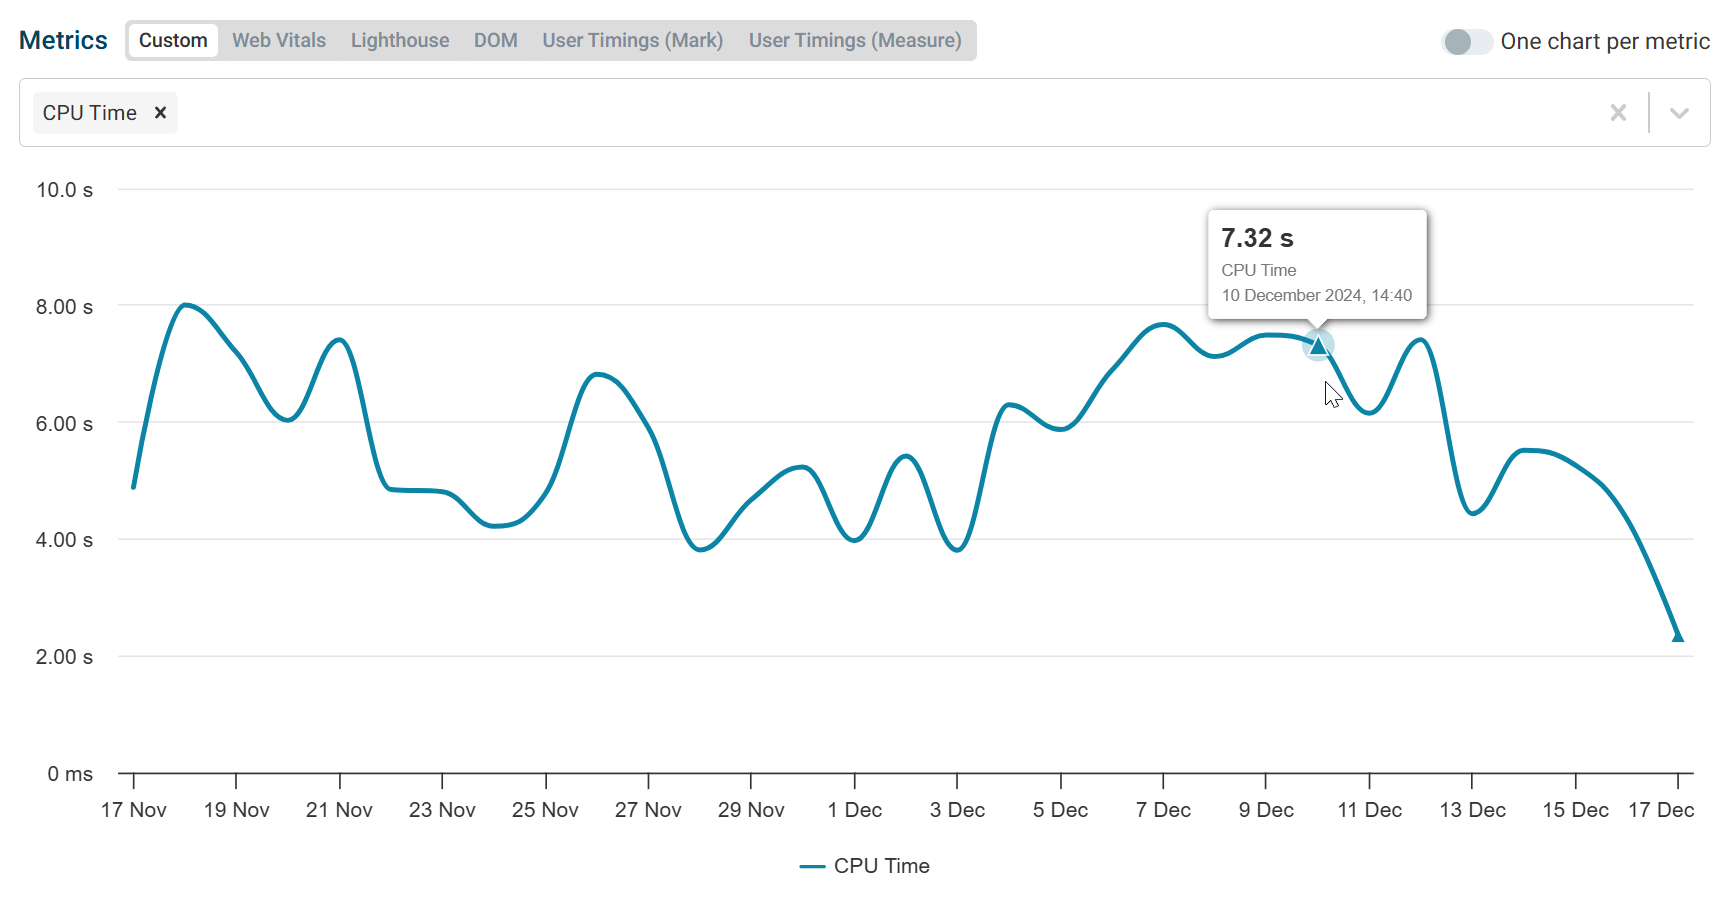
It’s also possible to add more metrics to the chart for comparison. When adding Total Blocking Time to the chart, we can see a similar trend for both metrics.
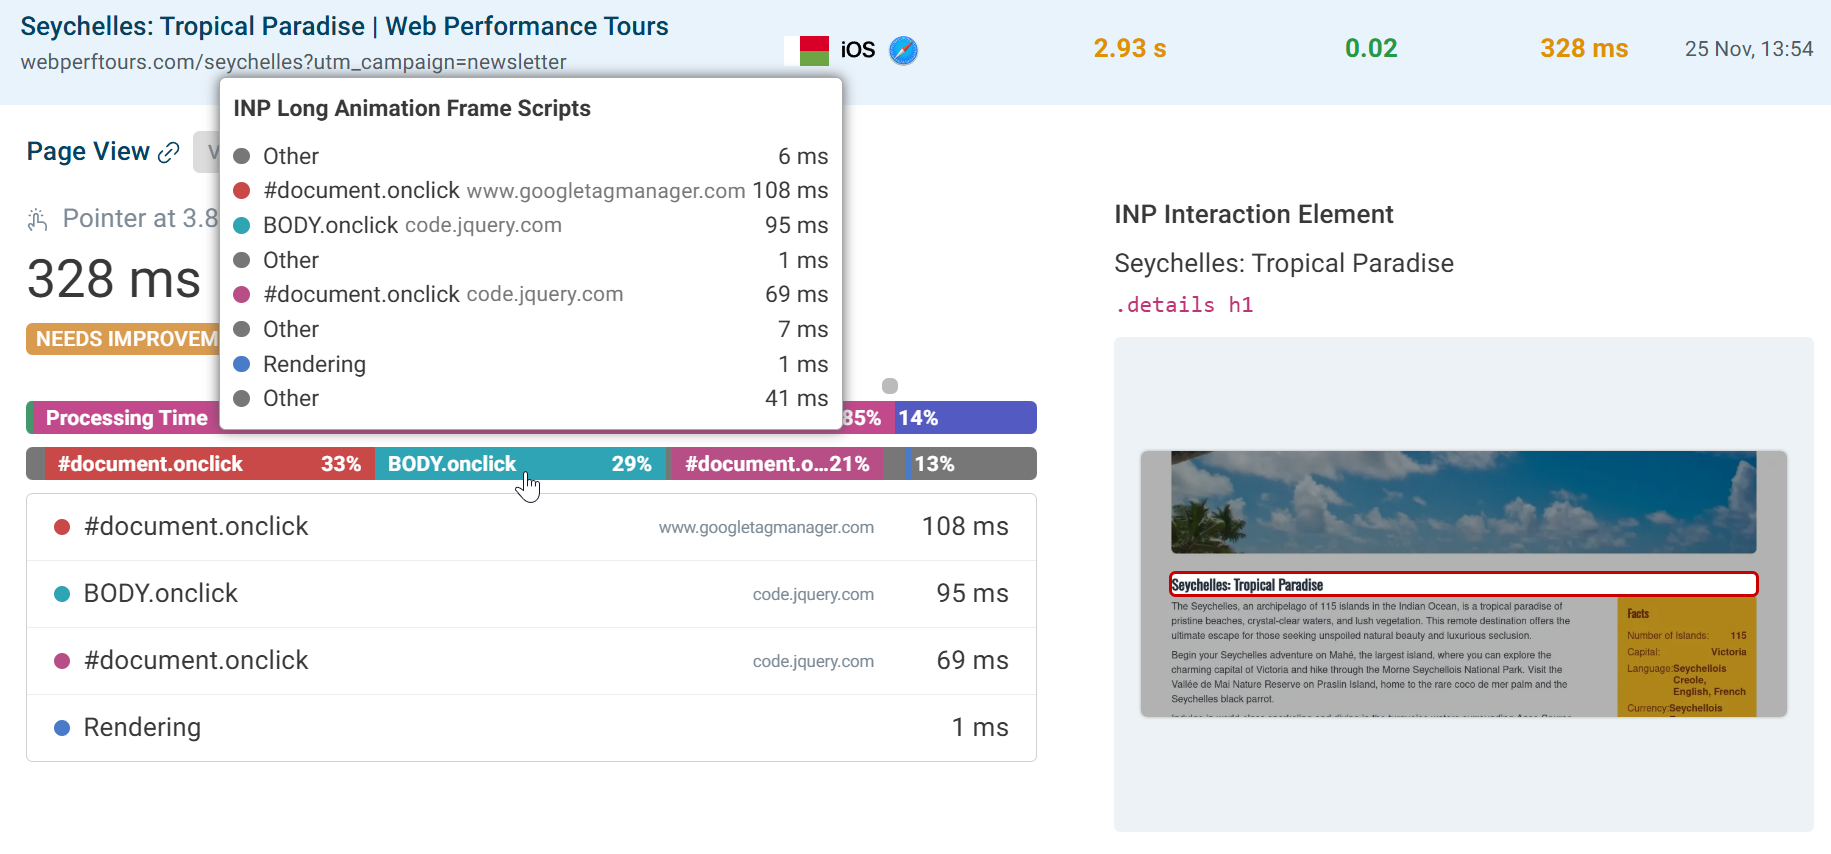
With DebugBear Real User Monitoring (RUM), it’s possible to receive Long Animation Frames (LoAFs) data for some page views. This breakdown helps identify how scripts are contributing to slow interactions from real visitors to your website.
Conclusion
In conclusion, CPU throttling is a valuable tool for optimizing website performance on slower devices. By mimicking real-world conditions, CPU throttling helps identify bottlenecks in rendering and JavaScript execution that might otherwise go unnoticed.


Monitor Page Speed & Core Web Vitals
DebugBear monitoring includes:
- In-depth Page Speed Reports
- Automated Recommendations
- Real User Analytics Data