JavaScript plays a key role in website performance, affecting load speed and user experience. Regular testing catches regressions early, preventing slowdowns or interaction issues.
This article covers how to use lab tests and Real User Monitoring (RUM) to monitor and improve JavaScript performance. Detailed performance data can help developers identify issues and fix regressions for a better user experience.
Lab Tests
A lab test is a synthetic test that measures site speed in a controlled environment. Monitoring your website consistently provides data to catch regressions before users encounter them.
JavaScript performance dashboard based on lab data
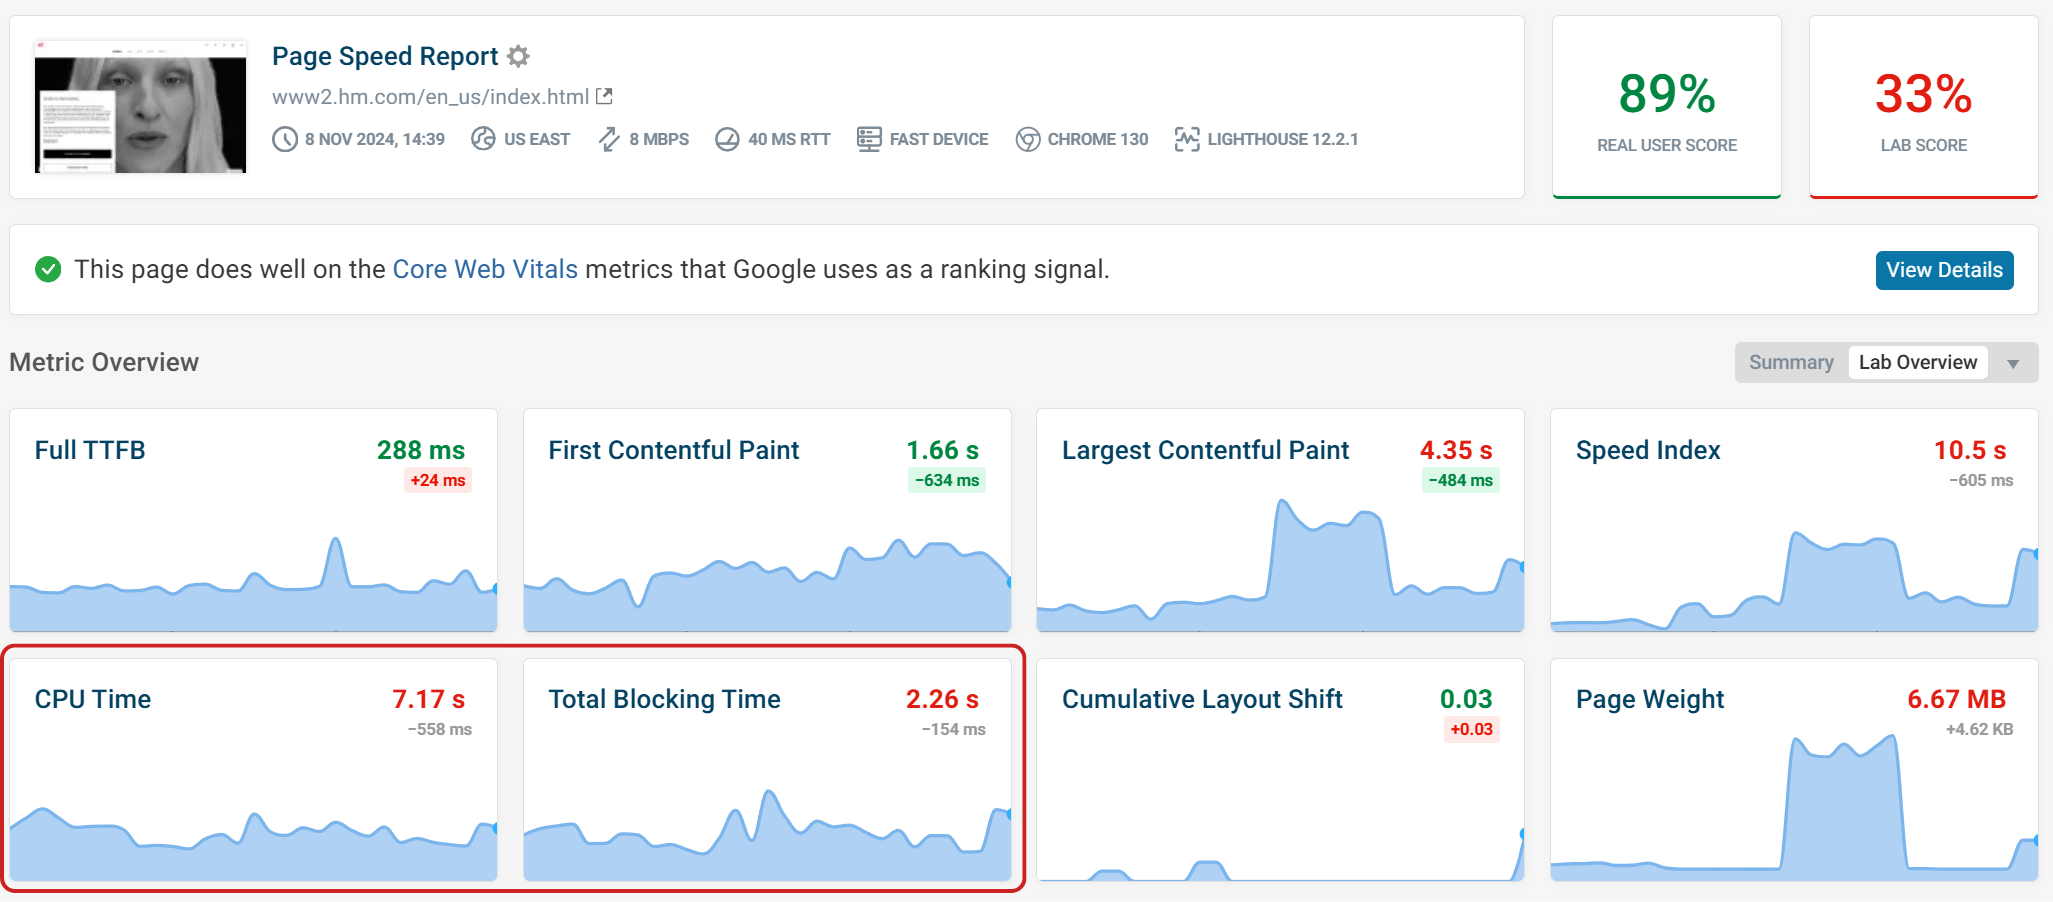
JavaScript performance of the initial page load can be effectively monitored through lab tests. All Core Web Vital metrics (except Interaction to Next Paint) are measured. Other metrics, like overall CPU time and Total Blocking Time (TBT) are also reported in the lab data.
CPU time and TBT metrics are closely related, as any task taking over 50 milliseconds is classified as a long task and becomes blocking, which can impact user experience as the page appears frozen.
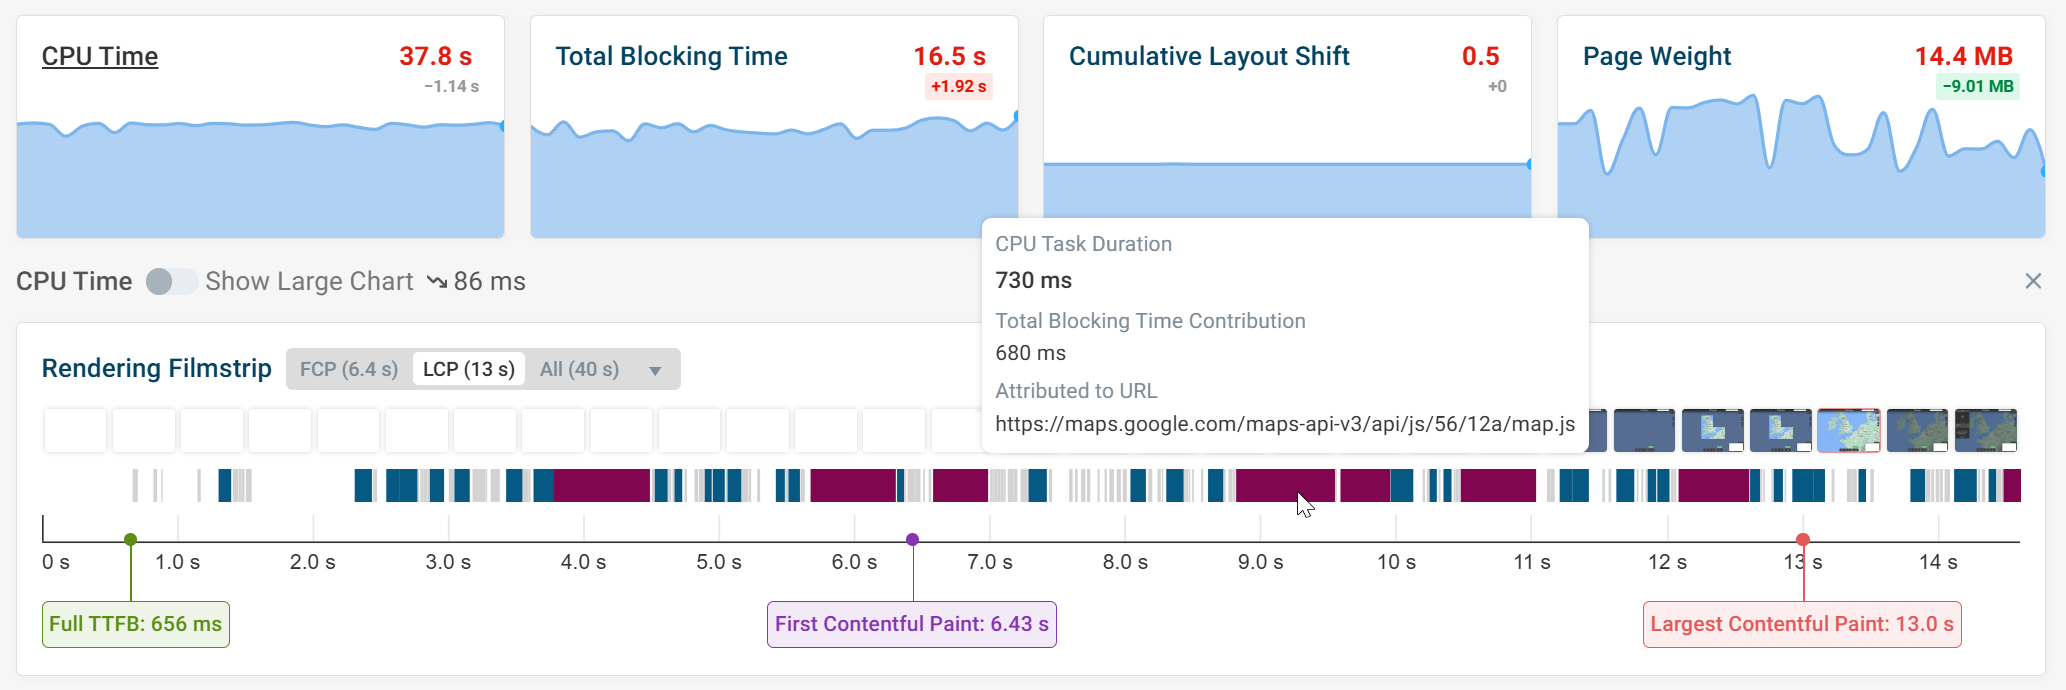
By clicking on these metrics in DebugBear you can view a timeline highlighting when long and blocking tasks occur during the page load.
In this example, we can see a flight tracking website which has a high CPU time and TBT. CPU tasks are highlighted in gray and blue, any tasks which become blocking are highlighted in red. Any long task before the First Contentful Paint milestone do not count as blocking.

Hovering over a long task reveals more details about the page load. Here, we see that the page cannot be rendered while the browser renders map data.
Experiments
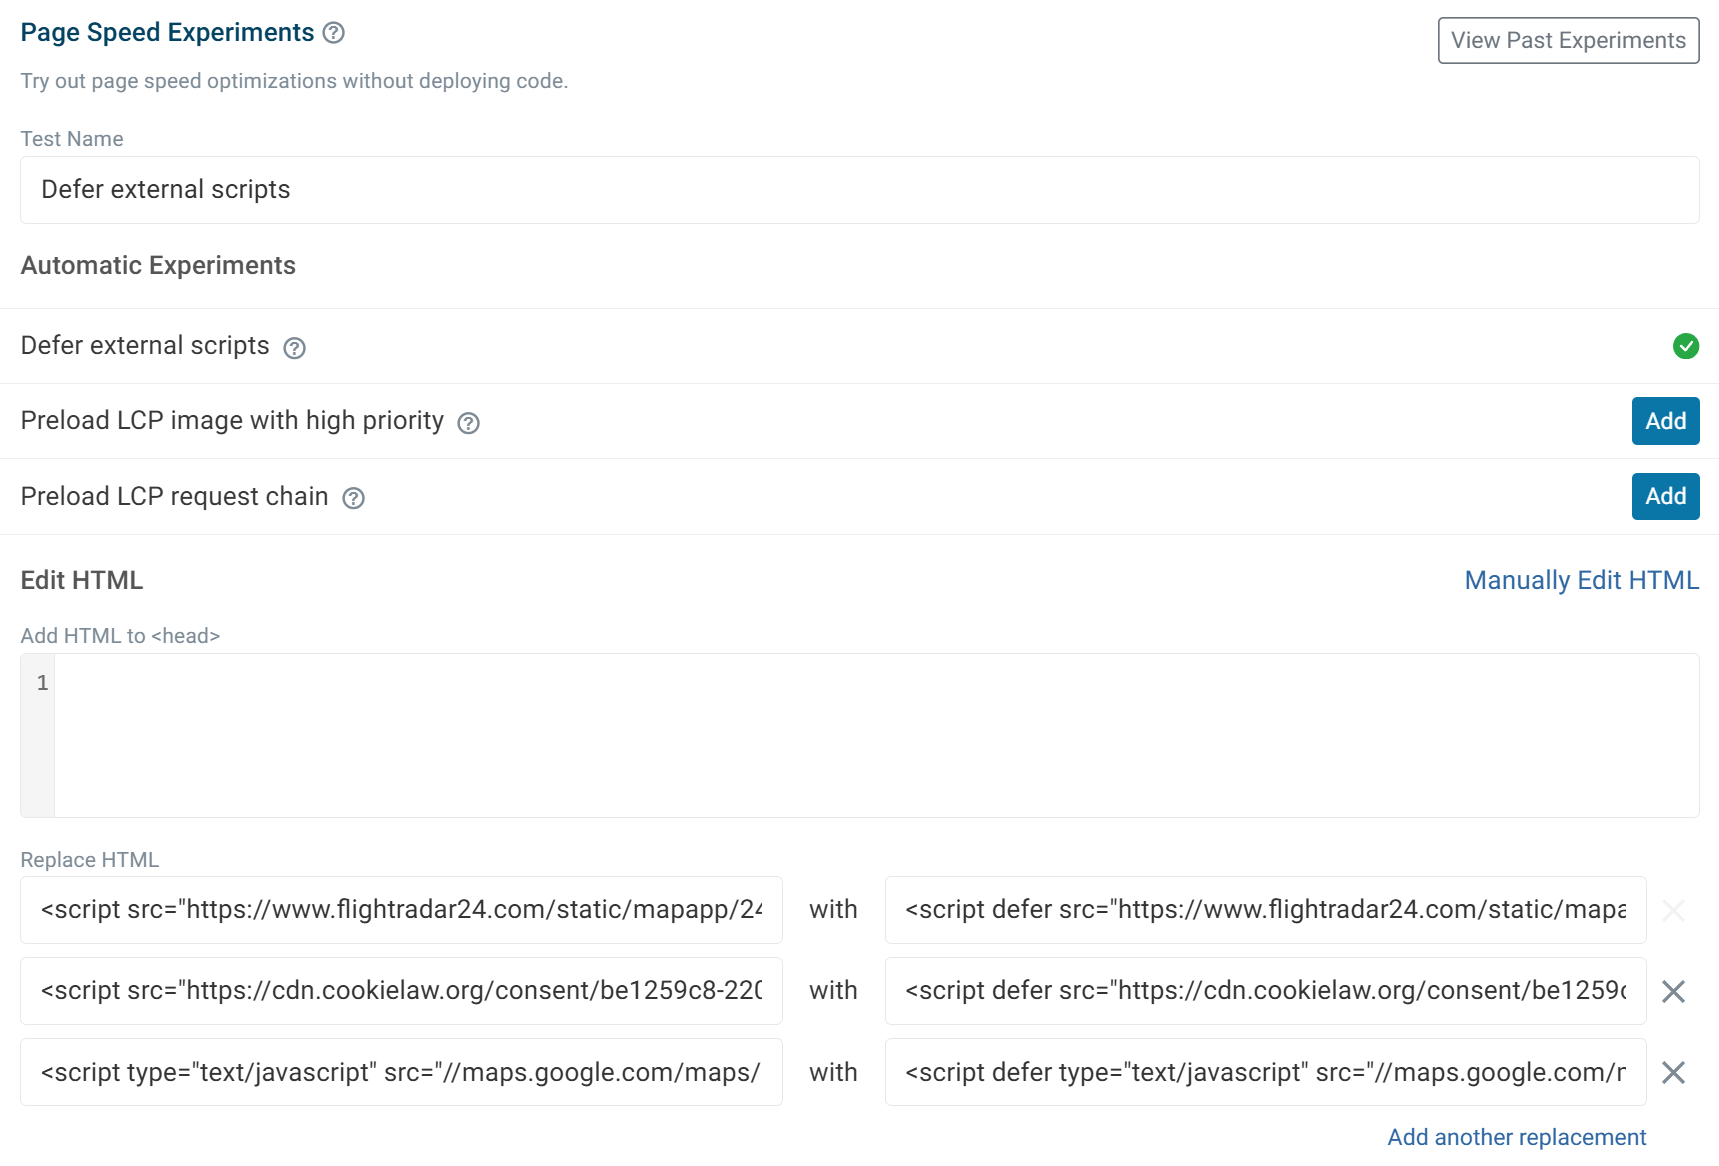
DebugBear’s experiment feature lets you test optimizations. This could be by blocking specific requests, deferring external scripts or preloading scripts. You can then see a before and after comparison showing the impact of the change.
Lighthouse
The Lighthouse tab offers a detailed breakdown of JavaScript performance within its diagnostic data.
The Minimize main-thread work section identifies areas where JavaScript may affect load speed and user experience.
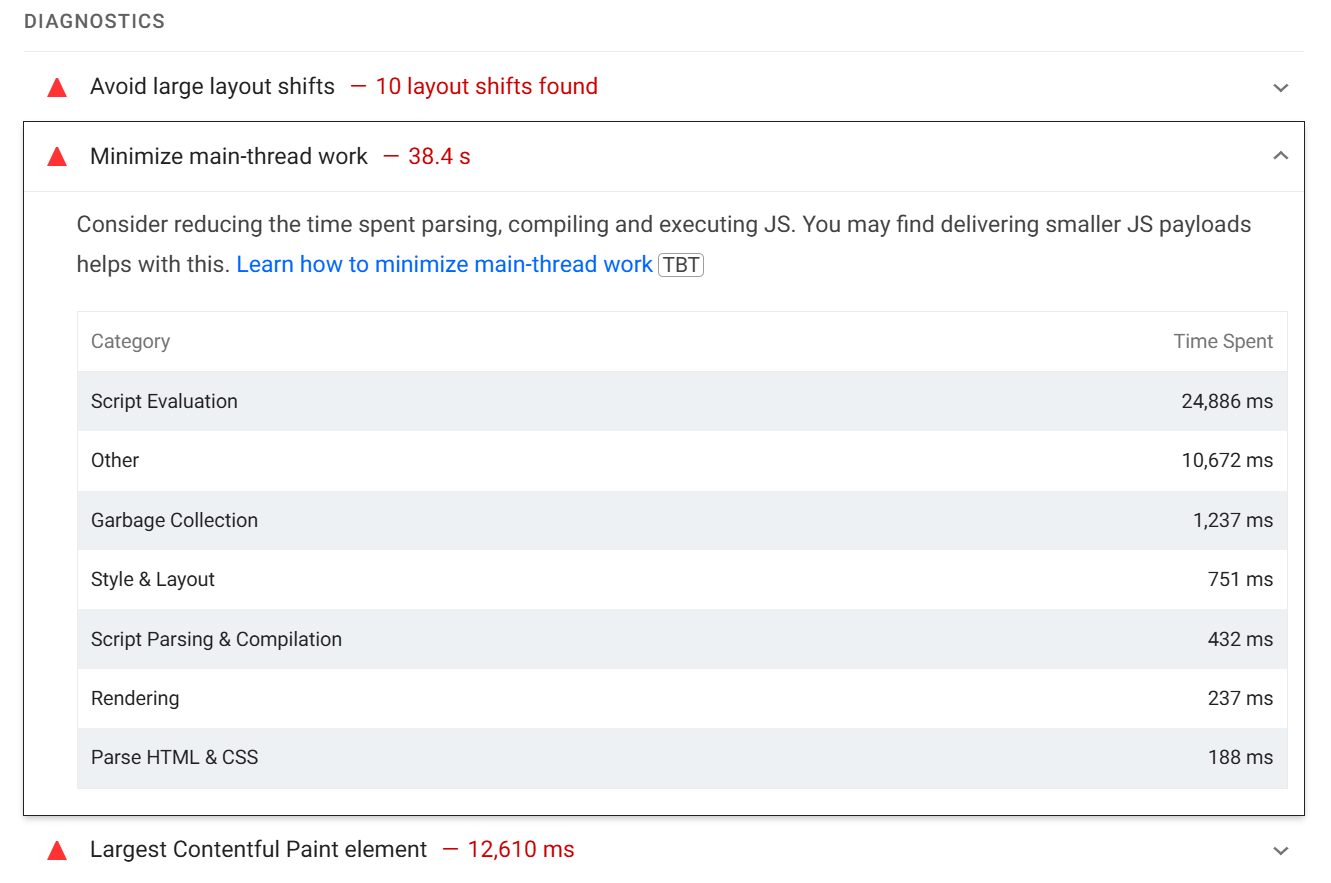
Below is a description of each of these categories:
- Script Evaluation: Time spent executing JavaScript on the page, impacting performance by consuming processing power and delaying other tasks.
- Style & Layout: Time for calculating CSS styles and determining page layout, which can increase with complex styles, large CSS files, or frequent layout changes.
- Garbage Collection: Time spent clearing unused JavaScript objects from memory while pausing other operations.
- Script Parsing & Compilation: Time for parsing and compiling JavaScript before execution; large JavaScript bundles increase this time.
- Rendering: Time for drawing visual elements on the screen after layout and styling, which can increase with complex visuals or frequent redraws.
- Parse HTML & CSS: Time spent reading HTML and CSS to build the DOM and CSSOM for rendering; may increase with large or complex files.
- Other: Time for miscellaneous tasks, such as asynchronous activities, browser-specific work, or network-related background tasks; high values indicate additional browser workload.
You can find the exact meaning of these categories in the Lighthouse source code.
Real User Monitoring
Real User Monitoring (RUM) gathers data on how real visitors interact with your website, offering valuable insights into actual user experiences.
By tracking metrics like Core Web Vitals over time, RUM helps you address critical page speed issues that could affect user experience. Ongoing data collection allows for a better understanding of performance trends and helps prioritize improvements that enhance overall usability.
RUM data provides immediate insights into user experience, helping to monitor JavaScript performance ahead of waiting for CrUX data.
RUM Dashboards
JavaScript execution plays a significant role in INP scores. With RUM, INP scores can be monitored continuously, providing an insight on page responsiveness.
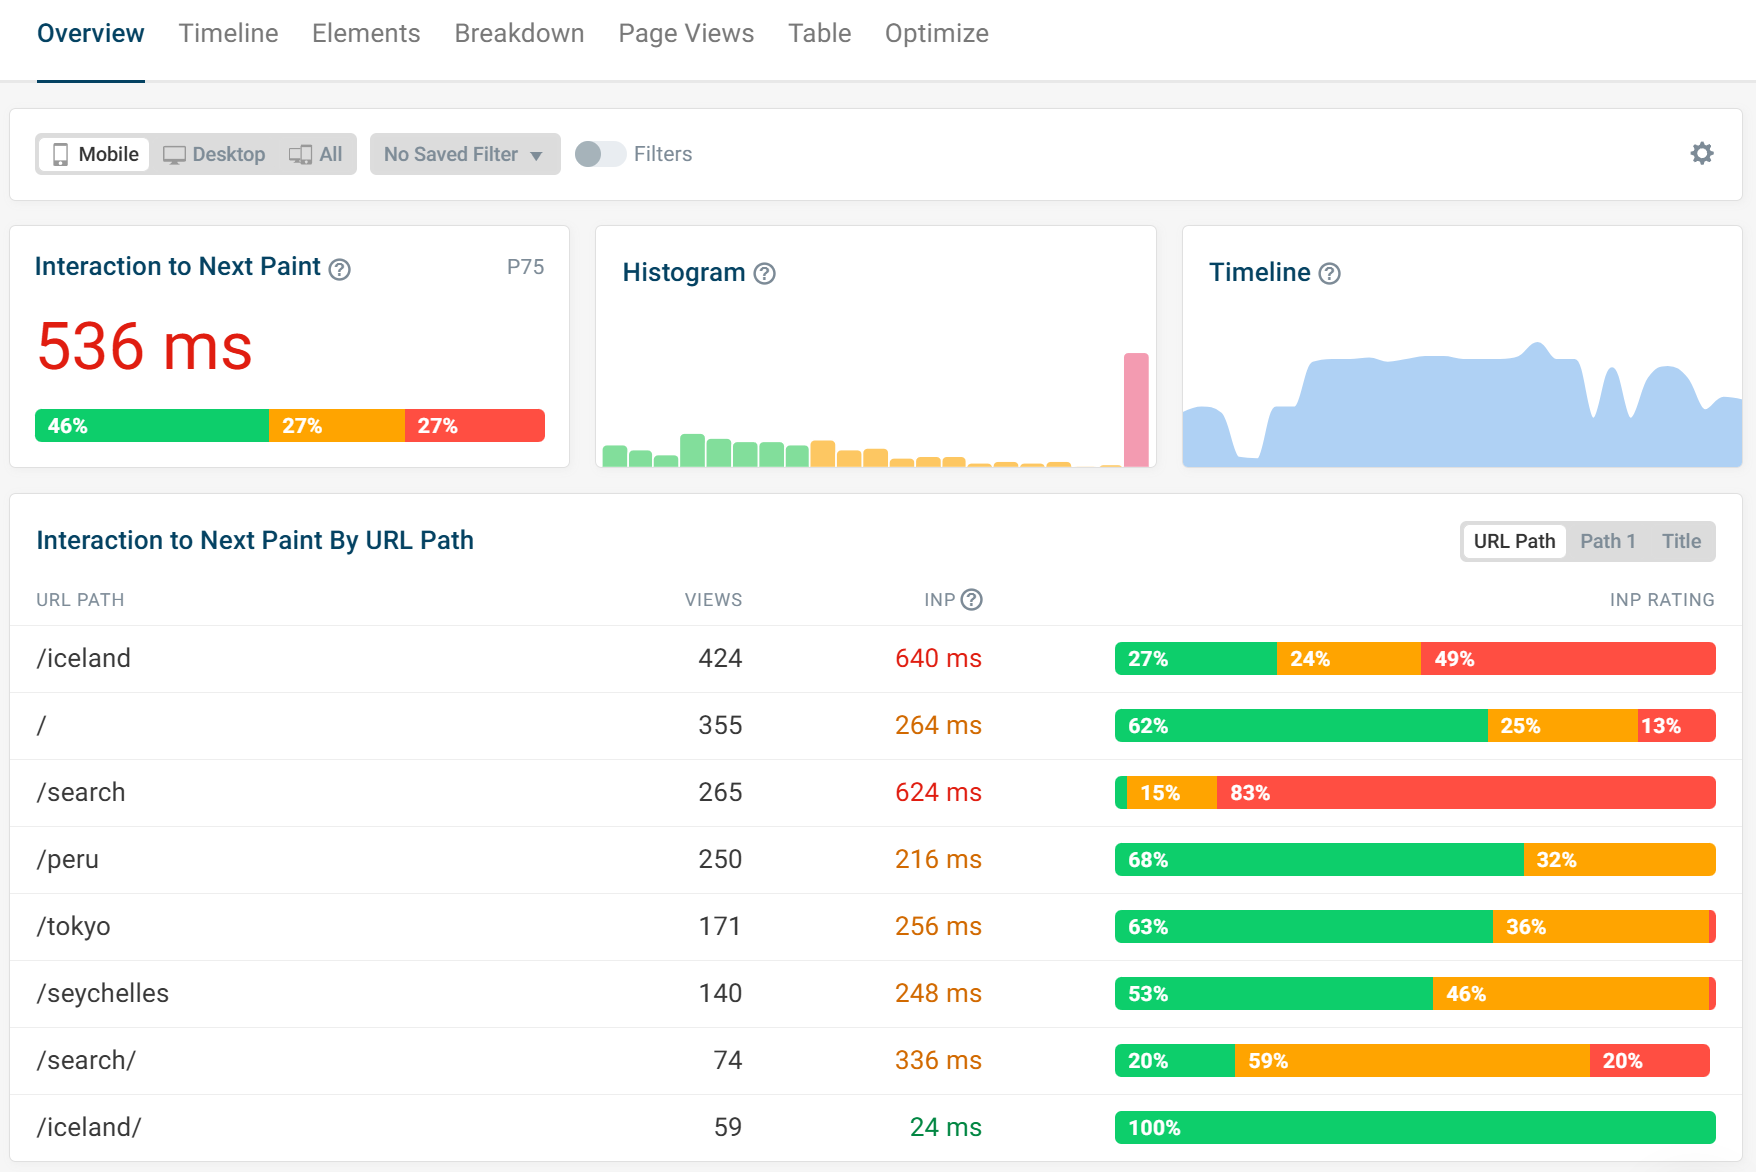
Each INP component has its own dedicated dashboard, allowing for more detailed analysis.
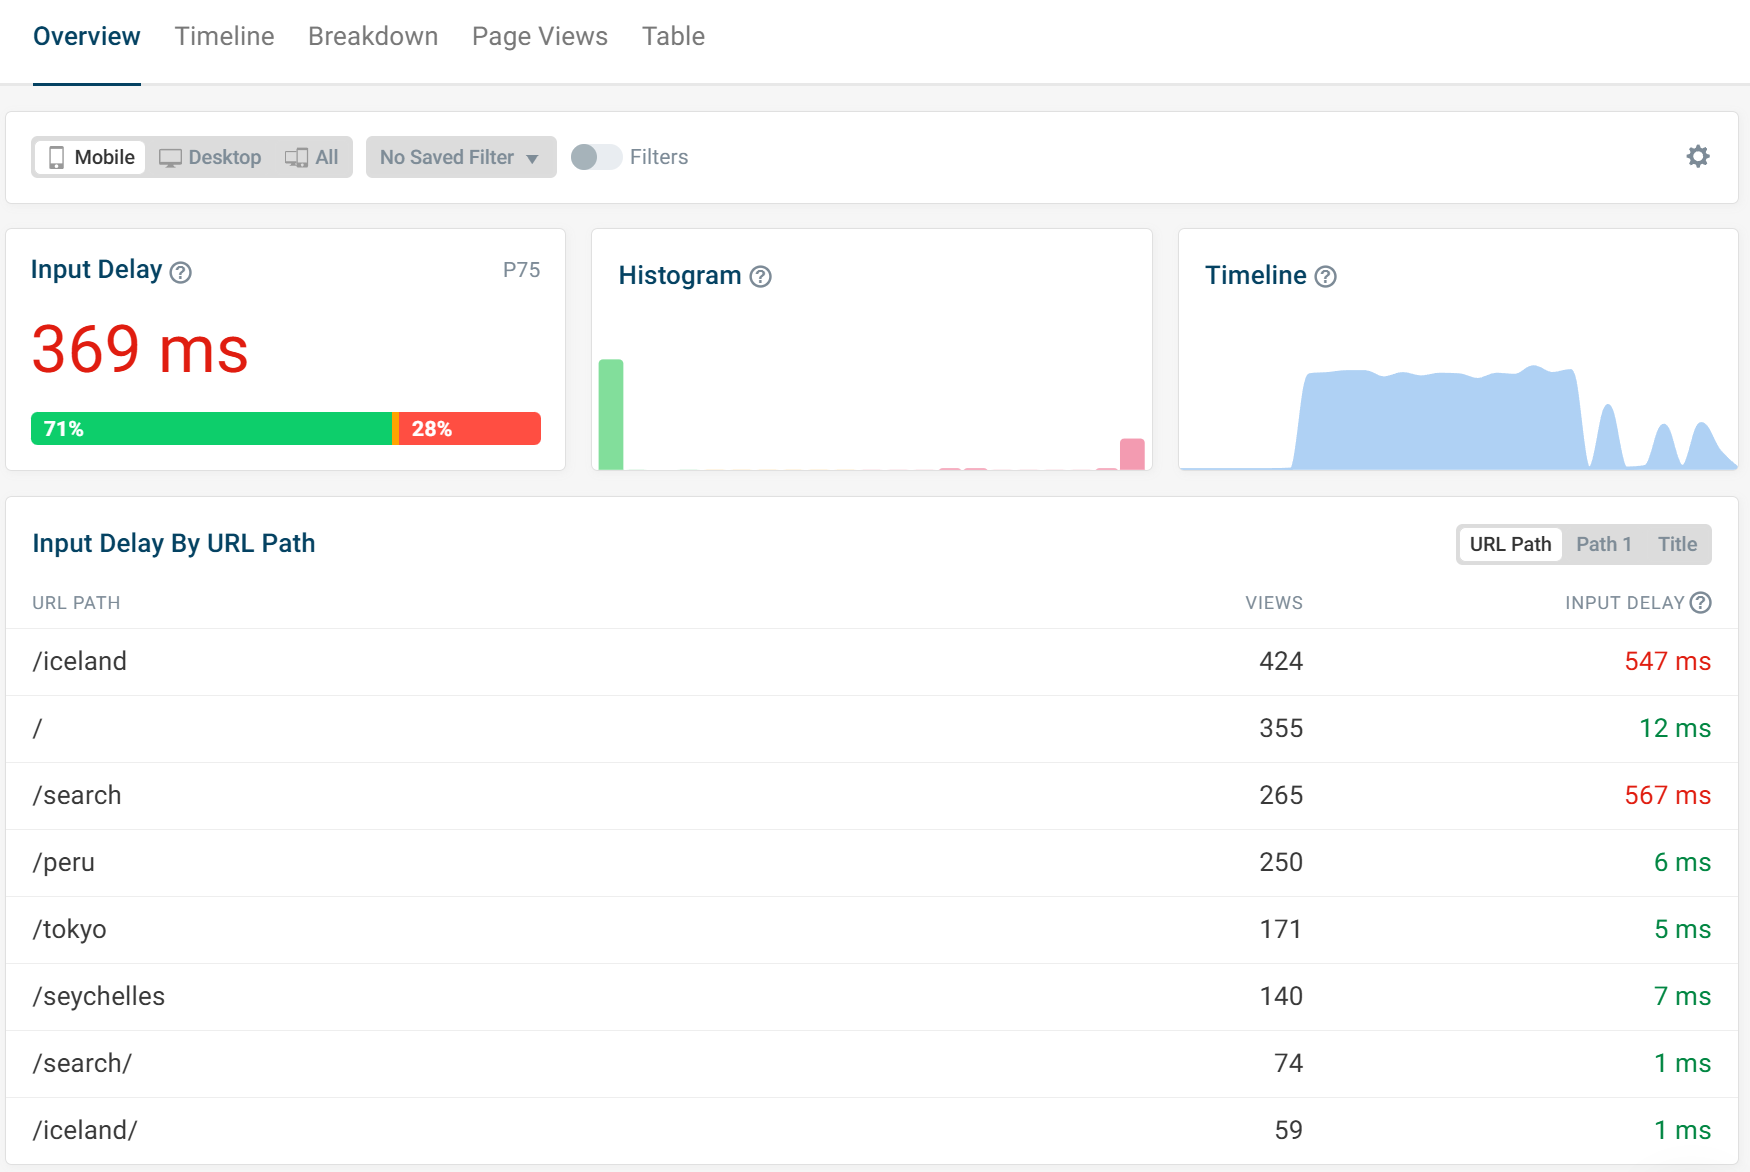
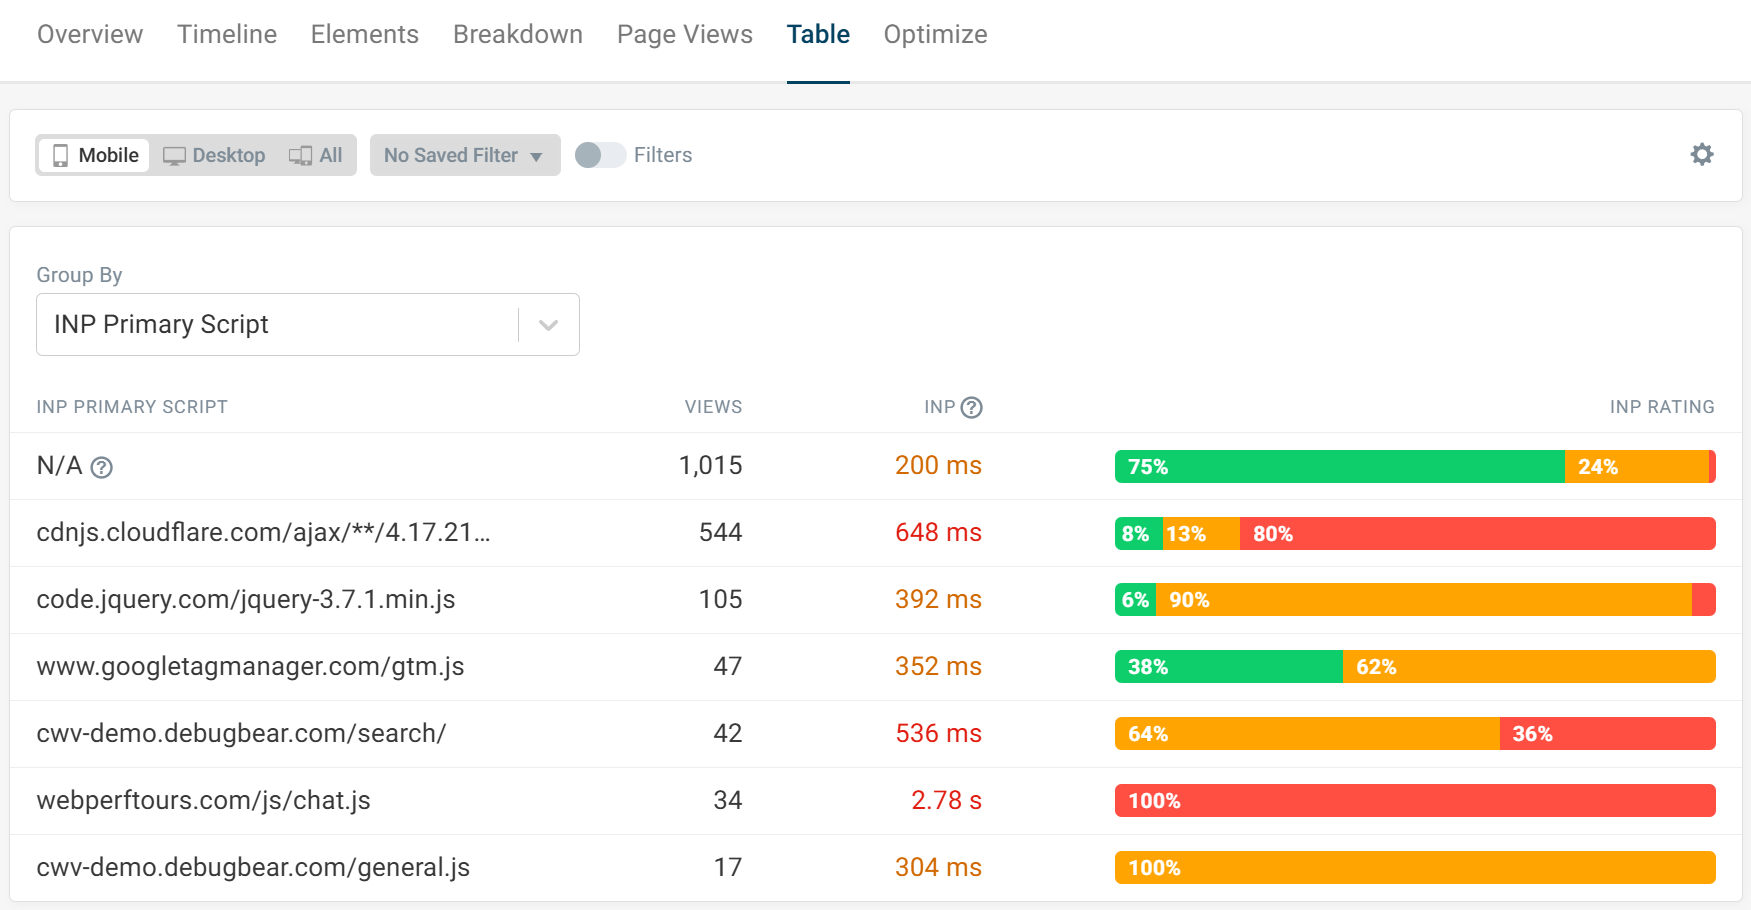
JavaScript Table View
The table view highlights scripts that impact your site's most visited pages. Providing an overview on which scripts are impacting INP scores the most. Certain scripts are unidentifiable by the browser due to privacy restrictions. Limiting visibility into their specific impact on performance metrics.
Page View
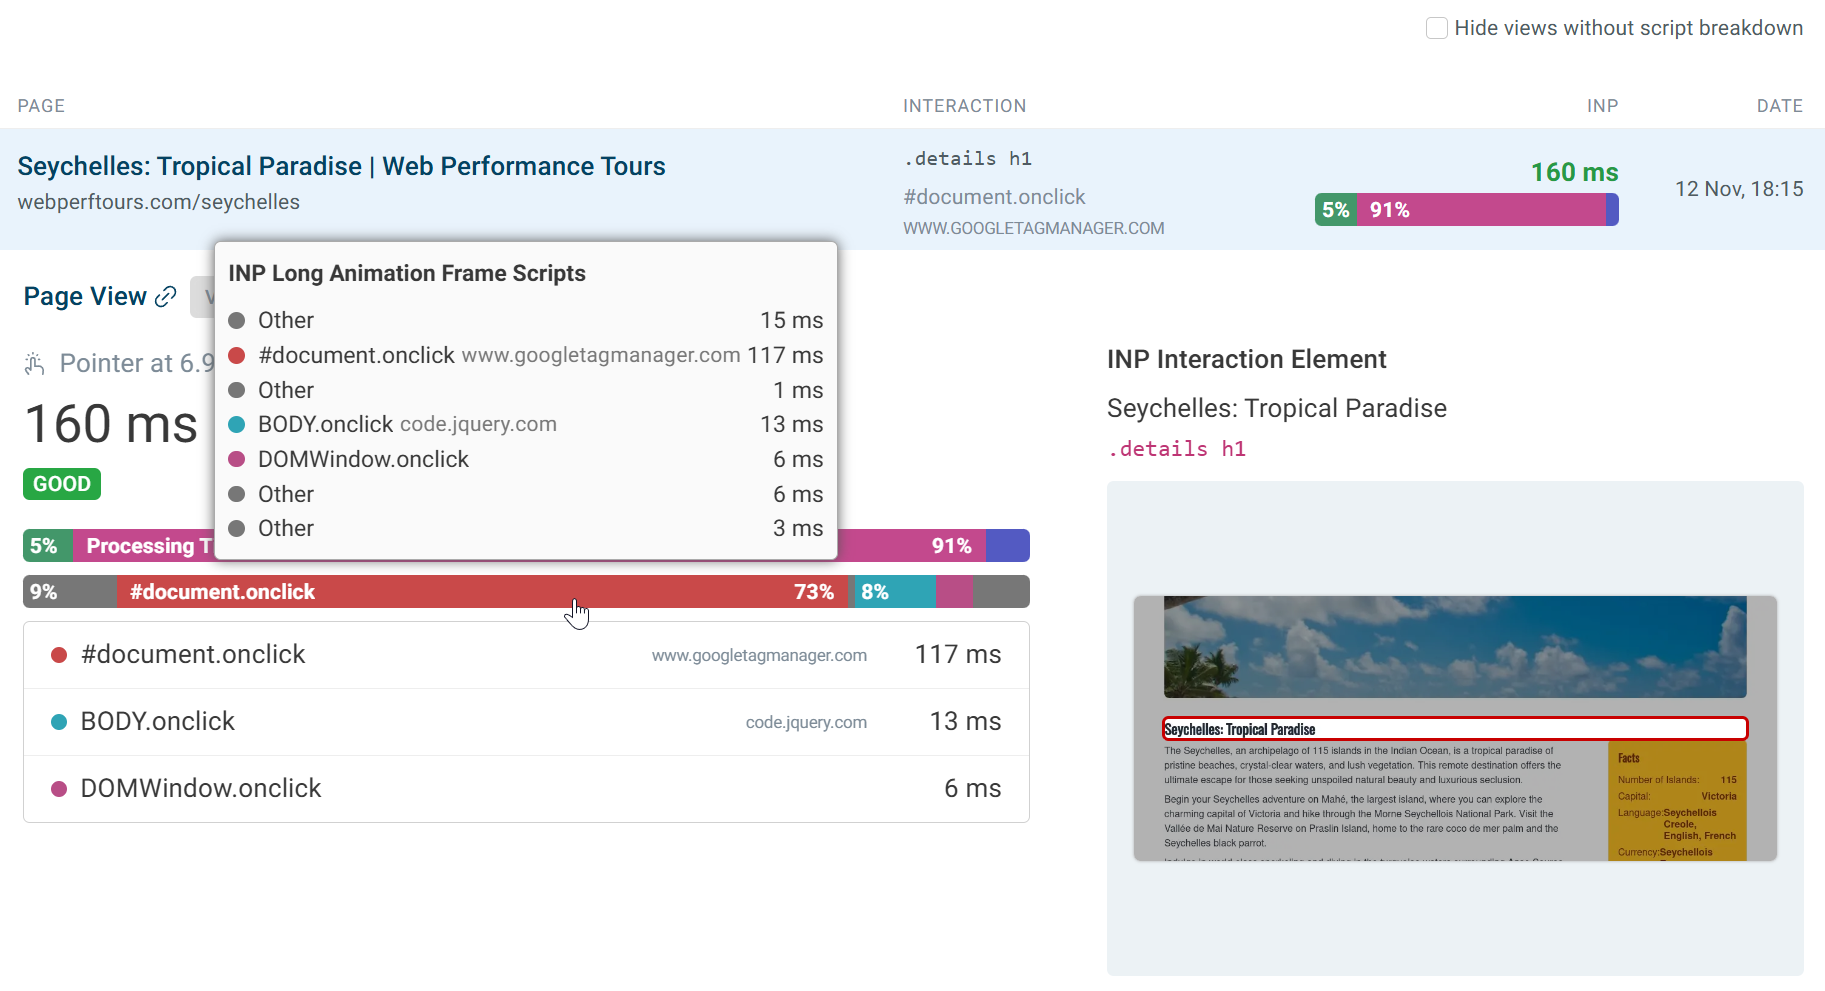
The RUM Page Views tab provides a detailed list of individual visits. Displaying the page title, URL, browser, device, location, and Core Web Vitals scores for each view.
The Long Animation Frames API is used to display a breakdown of long CPU tasks for an interaction. You can see what scripts contribute to the delay, why they are running, and whether processing time is spent running code, updating the layout, or because of a synchronous wait (for example for a synchronous XMLHttpRequest).
Conclusion
Using both lab data and RUM provides a complete overview of a page’s performance. Lab data offers controlled testing to catch issues early and validate optimizations before they go live. While RUM provides insights into immediate user experiences.
Together, lab and RUM data provide a comprehensive view of JavaScript performance. Combining synthetic testing with real user data to track and optimize performance over time.


Monitor Page Speed & Core Web Vitals
DebugBear monitoring includes:
- In-depth Page Speed Reports
- Automated Recommendations
- Real User Analytics Data