JavaScript execution time plays a crucial role in page load and page performance. The main thread being busy will result in slower rendering times. As well as this, user interactions can become unresponsive.
In this article we explore how monitoring JavaScript execution time helps identify opportunities for optimization.
Reduce JavaScript execution time in Lighthouse
If you want to see how JavaScript execution time is impacting your page speed, you can run a website test with Google Lighthouse.
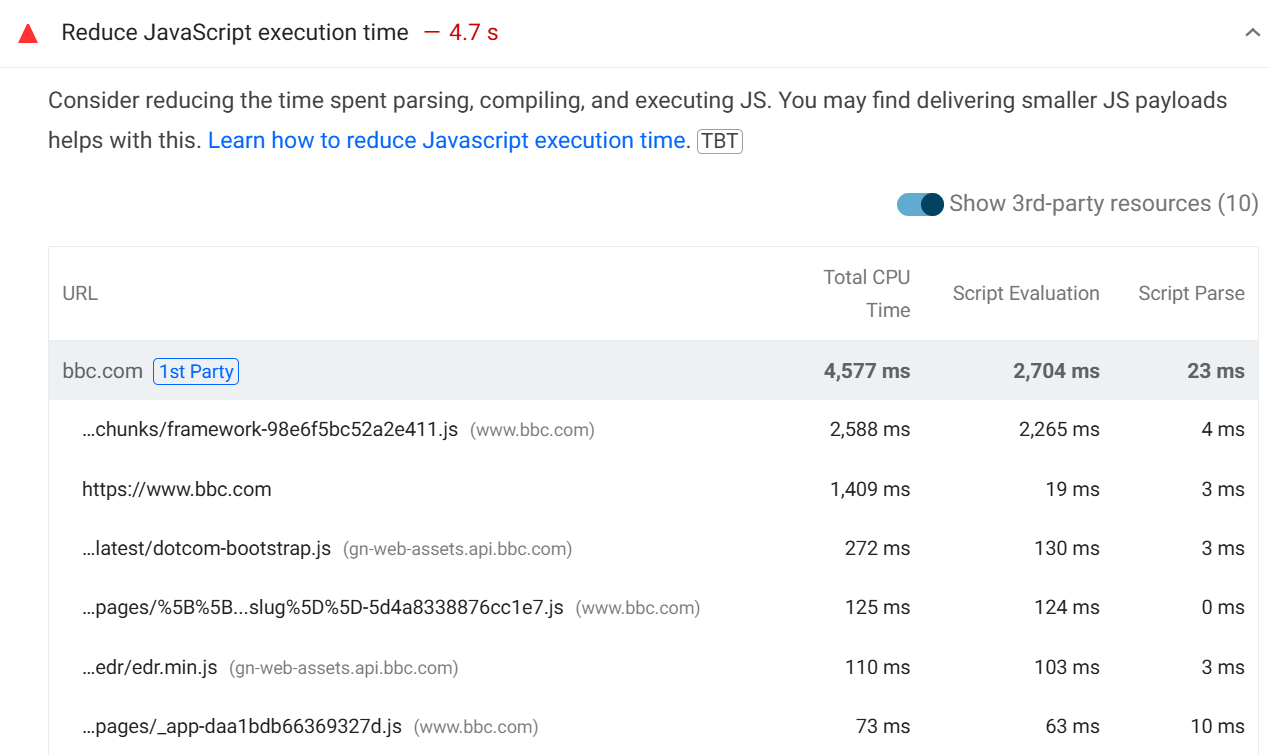
The Performance section of Lighthouse displays the JavaScript execution time. Search for the “Reduce JavaScript execution time” diagnostic audit. The execution time value appears, as well as a table breakding down the performance impact of different scripts.
Lighthouse shows a warning if JavaScript execution time exceeds 2 seconds. A fail displays if the duration rises above 3.5 seconds.
A passed audit displays further down, indicating acceptable performance levels.

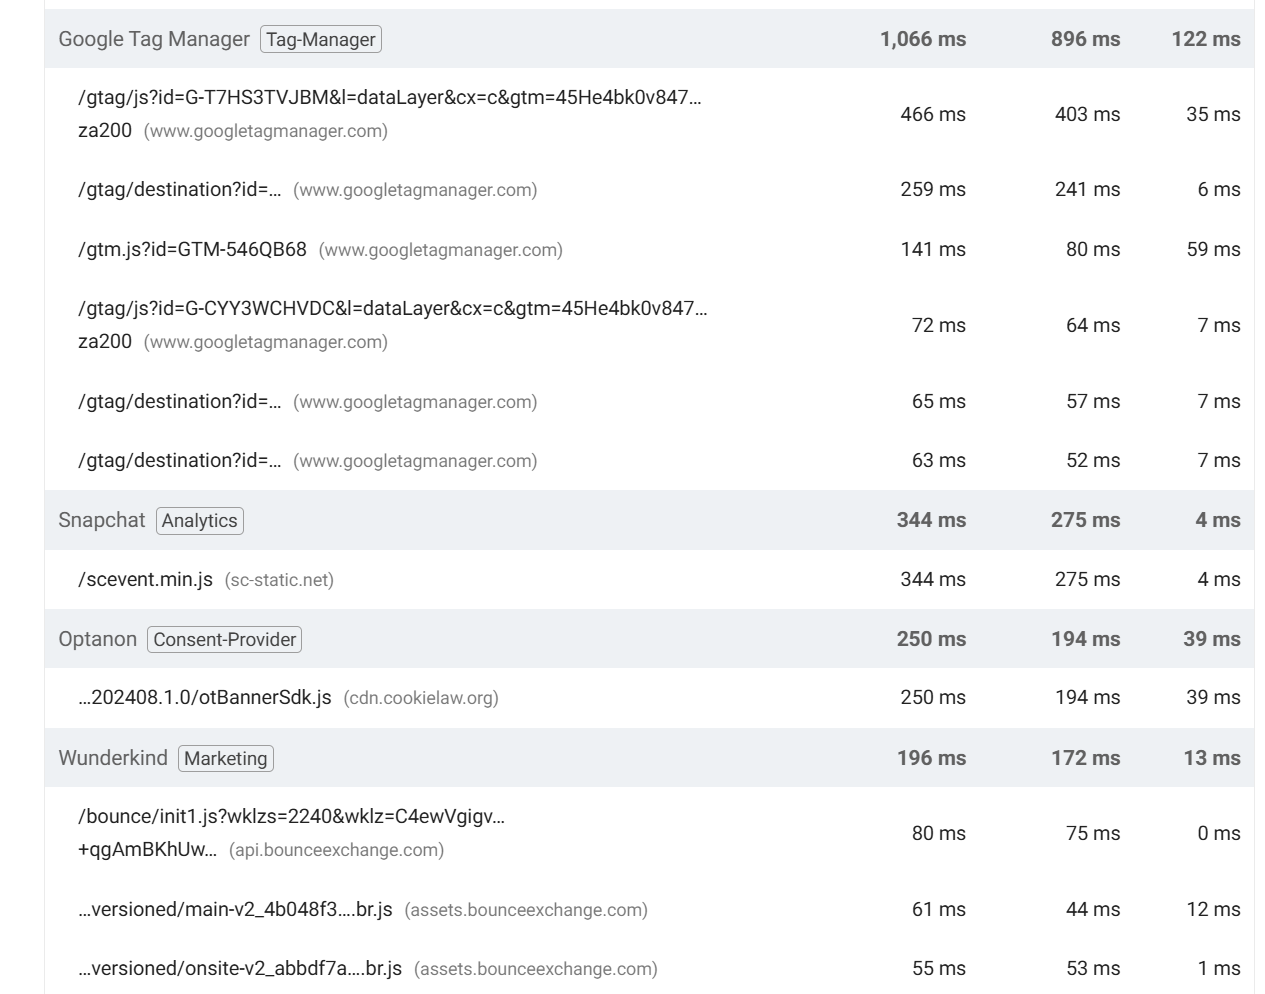
Each script is highlighted with a first or third party badge. Disabling the "Show 3-rd party resources" toggle removes third-party scripts from the analysis. This lets you focus on first-party scripts that you've developed yourself to focus optimization efforts on what is most manageable.
Third-party scripts can be challenging to optimize due as you have limited control over them. If these scripts impact performance, you can check the "Reduce the impact of third-party code" audit to inspect them separately.
What are script evaluation and script parse time?
Before the browser can run JavaScript code, the code first needs to be parsed and compiled.
The Script Parse Time in this audit includes both time spent parsing and compiling the script. Script Evaluation Time measures how much time is spent actually running the code.
Why does Total CPU Time not match the sum of evaluation and parse time?
Total CPU Time does not match the sum of evaluation and parse time because other factors also contribute to CPU usage.
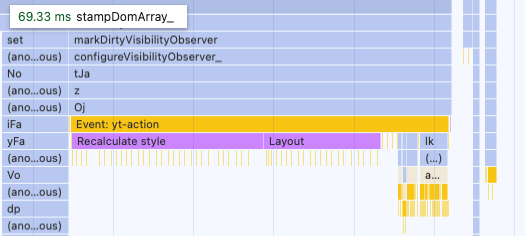
In addition to evaluating the JavaScript code, the browser also spends time on other tasks such as HTML parsing, layout calculations, rendering, and handling user interactions, all of which can add to the total CPU time for a given script.
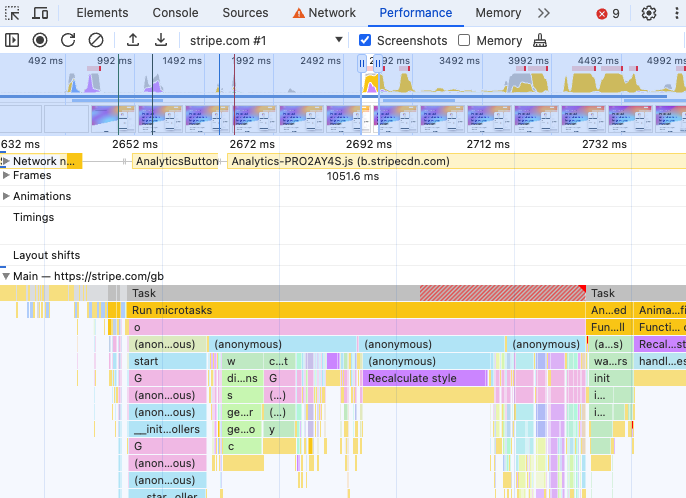
You can see an example of that in this DevTools performance profile, where a JavaScript file is triggering synchronous styling and layout work that runs between the JavaScript code itself.
JavaScript execution data in DebugBear lab tests
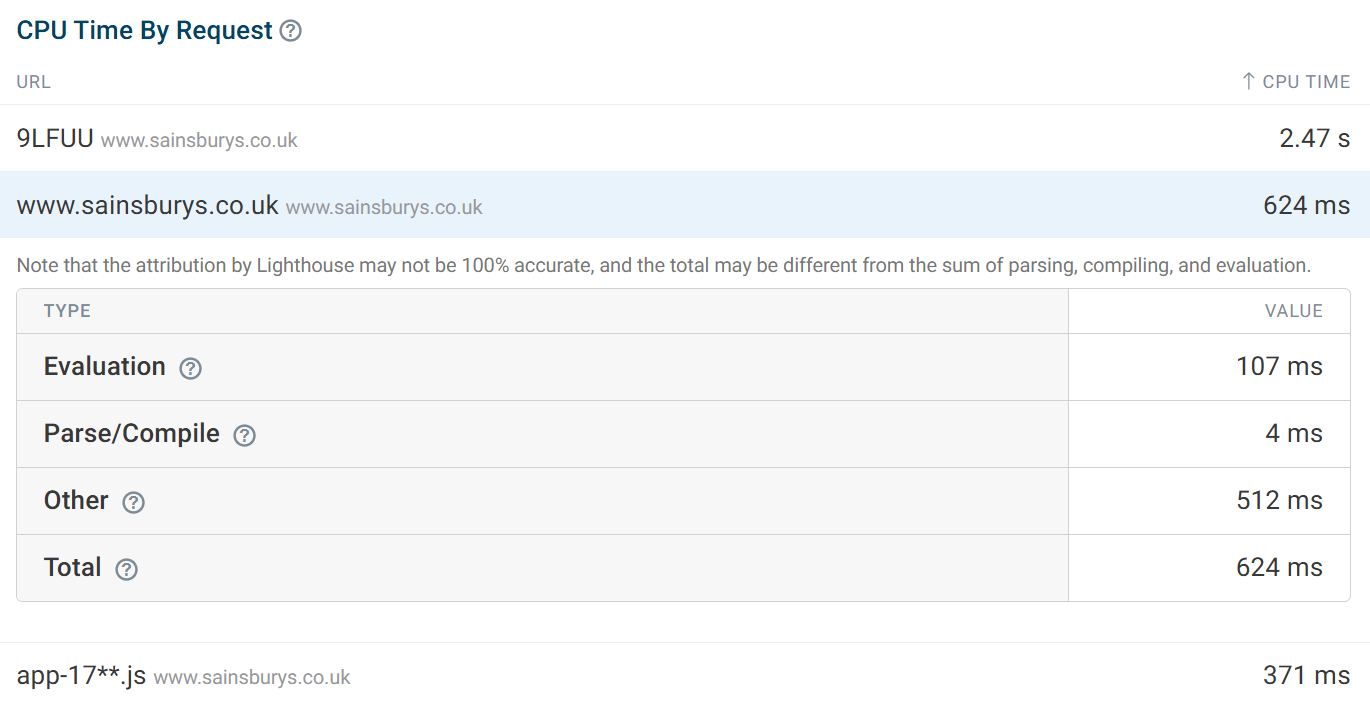
JavaScript execution data can also be found in the DebugBear lab tests by clicking on the CPU metric to view more detail.
You can then click into each script to get more details, as well as using Compare mode to view changes from previous tests that have been completed.
When monitoring pages with DebugBear, you can also set up performance budgets. If JavaScript execution time passes the set threshold, then you will be automatically notified, meaning that any regressions can be resolved as soon as possible.
Does the Reduce JavaScript Execution Time audit impact my Lighthouse score?
JavaScript execution time does not directly impact the Lighthouse score. However, execution time plays a role in Total Blocking Time (TBT), which measures CPU tasks taking over 50 milliseconds. TBT accounts for 30% of the overall performance score in Lighthouse.
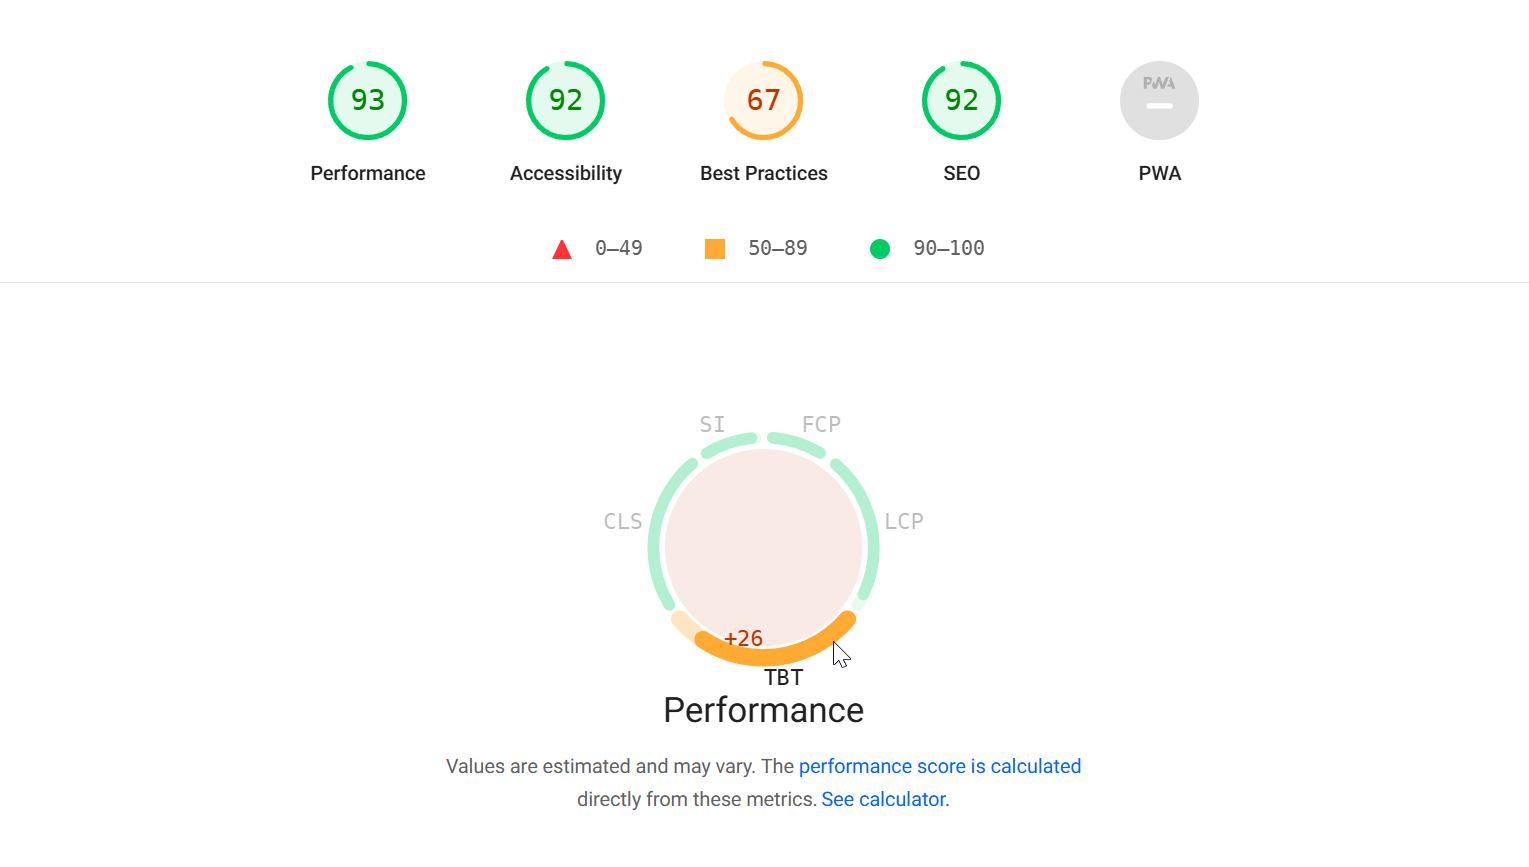
The Lighthouse Scoring Calculator is helpful to understand how each metric influences the performance score.
Reducing TBT could potentially improve Interaction to Next Paint and speed up user interactions. However, this metric isn't measured in Lighthouse since no interactions occur during the test. To measure INP you need real user monitoring.
How to reduce JavaScript execution time
Now that you have an analysis of JavaScript execution that occurs on your page, you can then take steps to lower the execution time. Here are some common steps that can be taken to optimize.
Collect a DevTools performance profile to investigate JavaScript execution
The Chrome DevTools performance profiler is a great tool for examining how scripts affect page load. You'll get detailed information on what code is taking the longest to run.
Remove unnecessary third parties
As mentioned before, third party scripts often contribute significantly to JavaScript execution time. This means that talking to vendors about performance or experimenting with better performing competitors can speed up your website. If you have many third-party scripts on your website there's also a good chance that some of them can be removed completely.
Use real user monitoring data to identify scripts that impact visitors
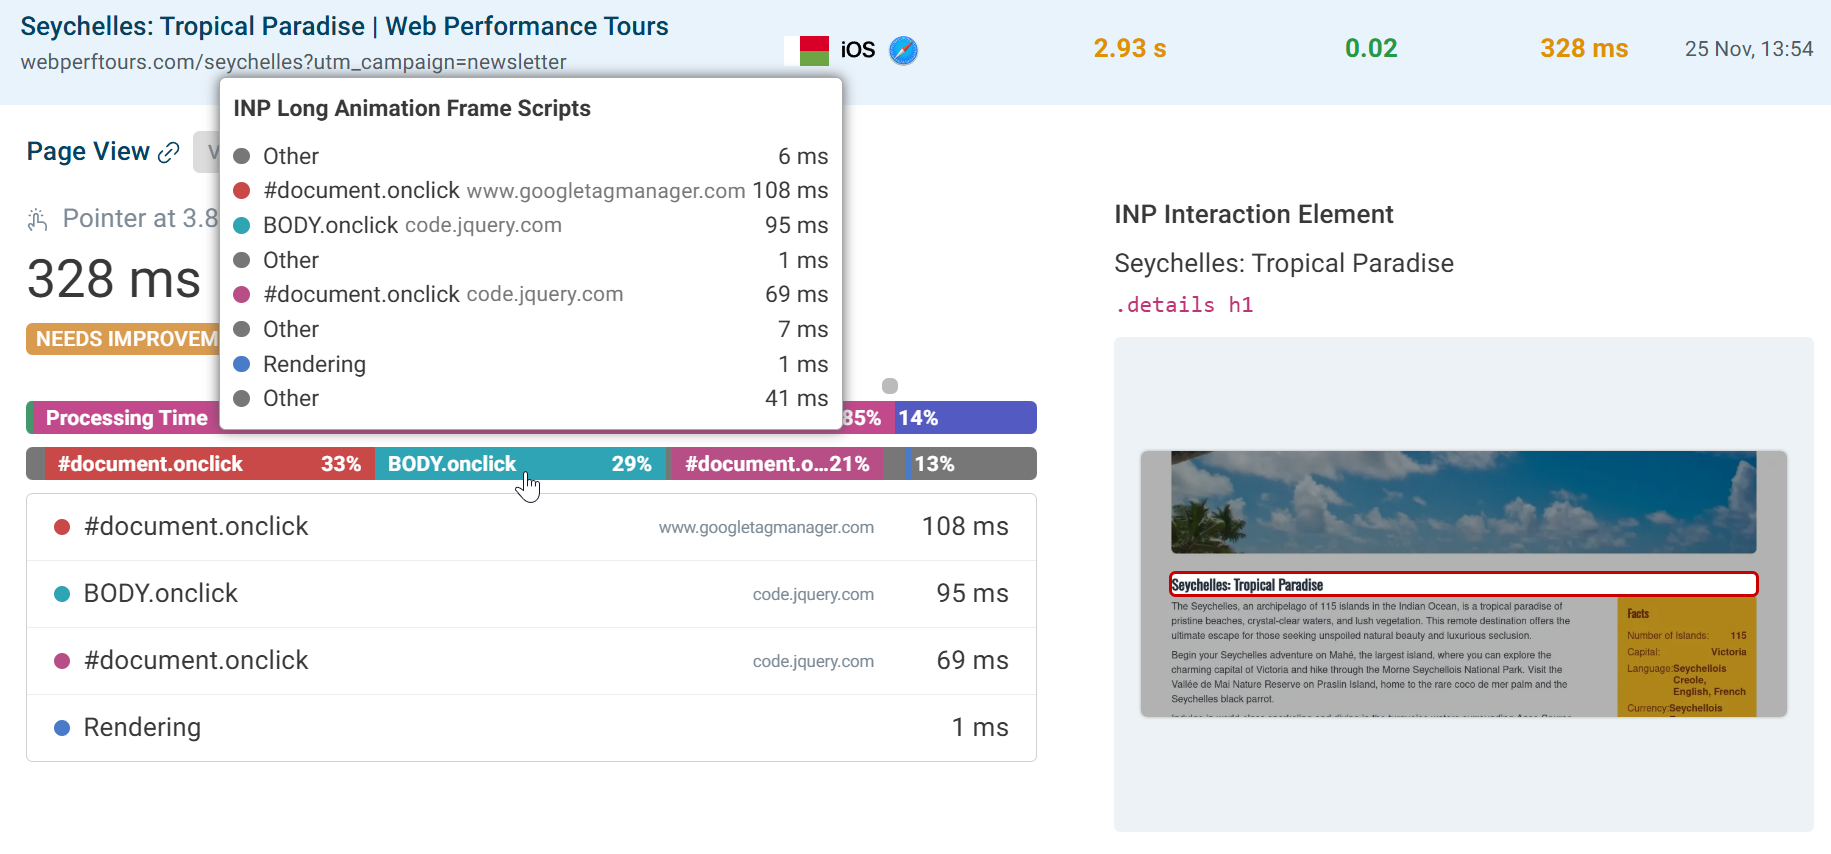
Real User Monitoring (RUM) allows you to understand how scripts are impacting real visitors to your website.
The page views tab shows data for individual visits. Highlighting which scripts are slowing down interactions. Slower interactions could be caused by scripts that can be sped up or broken into smaller chunks.
Conclusion
Identifying scripts during page load through lab tests helps pinpoint slow page loads.
The DevTools performance profiler can reveal which scripts could be deferred. While replacing or removing unnecessary third-party scripts offers a quick way to boost performance.
Monitoring your site with DebugBear RUM highlights how these potential changes affect user experience. Taking these steps can make your pages faster and interactions faster.


Monitor Page Speed & Core Web Vitals
DebugBear monitoring includes:
- In-depth Page Speed Reports
- Automated Recommendations
- Real User Analytics Data