Vue DevTools is specifically designed to take the Vue development experience to the next level. It’s a powerful, versatile, and user-friendly tool that simplifies the process of building, debugging, and optimizing Vue applications. Whether you’re a seasoned developer or just getting started with Vue, this tool can significantly enhance your workflow and productivity.
Its creator prepared an interactive playground on StackBlitz that you can check out here.
Overview of useful Vue Devtools features
One of its standout features is live editing, which allows us to make changes to our app’s properties in real time and instantly see the results without having to refresh or reload. This makes testing and iterating on ideas much faster and more efficient.
Another game-changing feature is time travel debugging, which lets us explore our app’s state at different moments in time. We can pinpoint issues by tracking how the state evolves, making it easier to identify and resolve bugs.
In addition, Vue DevTools provides detailed component inspection, giving us deep insights into how our app’s components, data, and state interact while also giving us ability to locate the component easily thanks to highlighting as indicated below:
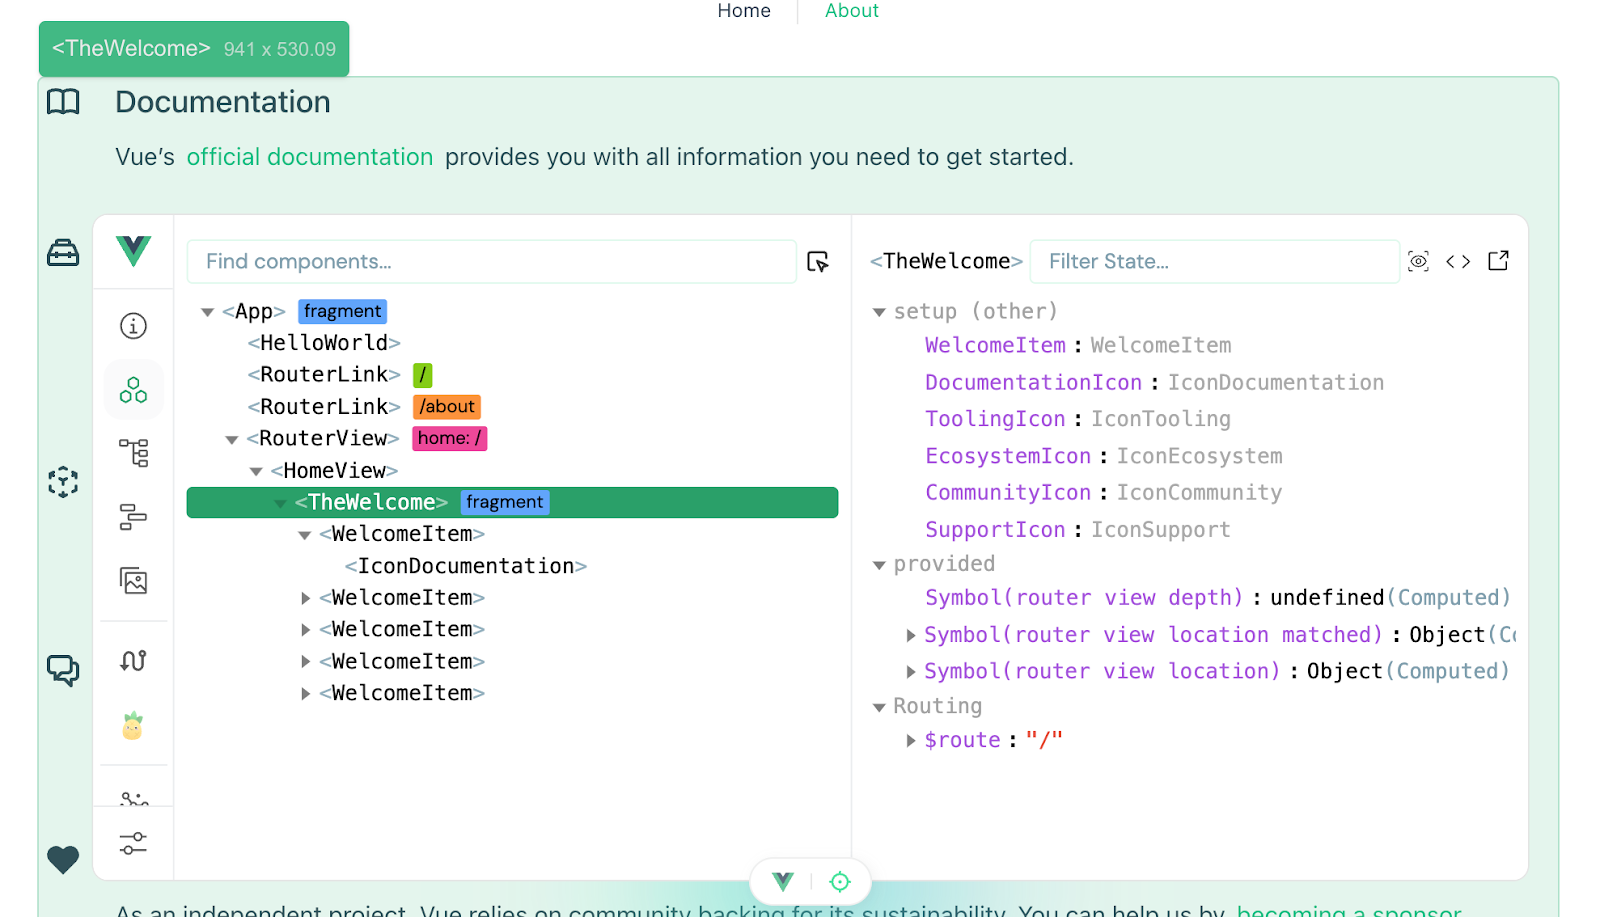
With the ability to view component hierarchies, props, and events, we gain a clearer understanding of our application’s inner workings.
How to use Vue DevTools in your project
There are two ways how you can use Vue Devtools in your Vue project and each comes with its own advantages:
- Browser extension - Install the extension from this link
- NPM package - Install
@vue/devtoolsin your Vue project
The npm package allows to use Vue Devtools in applications where browser extensions are not available, such as:
- Electron apps
- Mobile apps (e.g., with NativeScript or Capacitor)
- Server-rendered applications during development
After installing the extension or the npm package and running our Vue project in development configuration we should see the tab at the bottom of the screen with the Vue icon and the target icon. Clicking the Vue icon should open up a Vue Devtools tab that will look like this:

By default, Vue Devtools works in development mode. To enable it in production, you need to explicitly configure your app by running this code:
Vue.config.devtools = true;
Inspiration from the Nuxt Ecosystem
Fun fact - Even though the Vue Devtools browser extension was introduced a long time ago, the release of the package happened around a year ago and it was actually inspired from a framework built on top of Vue: Nuxt.
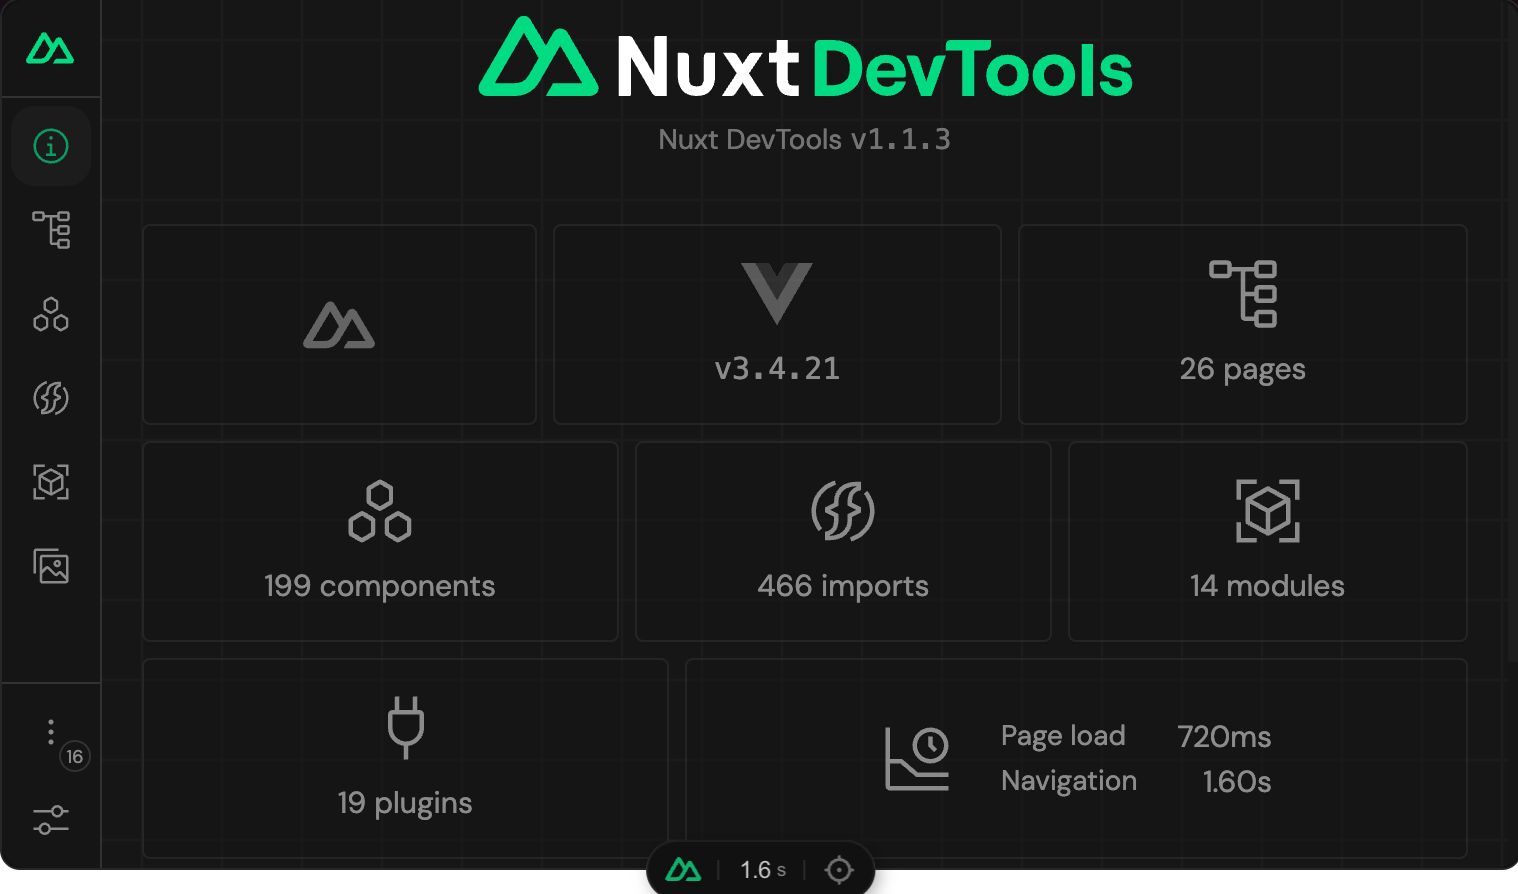
Anthony Fu created Nuxt Devtools to help Nuxt developers improve the Developer Experience of building web apps with Nuxt. First introduced as a separate Nuxt module, Nuxt Devtools are now built into of every Nuxt application.
Nuxt Devtools delivers the same functionality as Vue Devtools but comes also with additional data such as:
- Installed modules and registered plugins
- Registered config files (app / runtime / private runtime - only available during development)
- Payload data
- Server routes
Using Vue DevTools to measure performance
Vue Devtools includes powerful features for analyzing and optimizing the performance of Vue.js applications. These tools help developers identify bottlenecks, measure rendering times, and debug performance-related issues, ensuring smooth and efficient applications.
The best place to start measuring performance in your Vue app with the usage of Vue Devtools is actually the Timeline tab that can be found in the navigation tab on the left side as shown below:

To enable performance monitoring, we need to enable it so that the Performance section will be highlighted. Press Start recording as shown below:

Keep in mind that the events captured by the timeline can cause noticeable performance overhead in large and complex applications. DevTools authors recommend enabling it only when it is actually needed.
After we start interacting with the page, we will be able to see how much time is spent on tasks like rendering, updating, or initializing certain components.
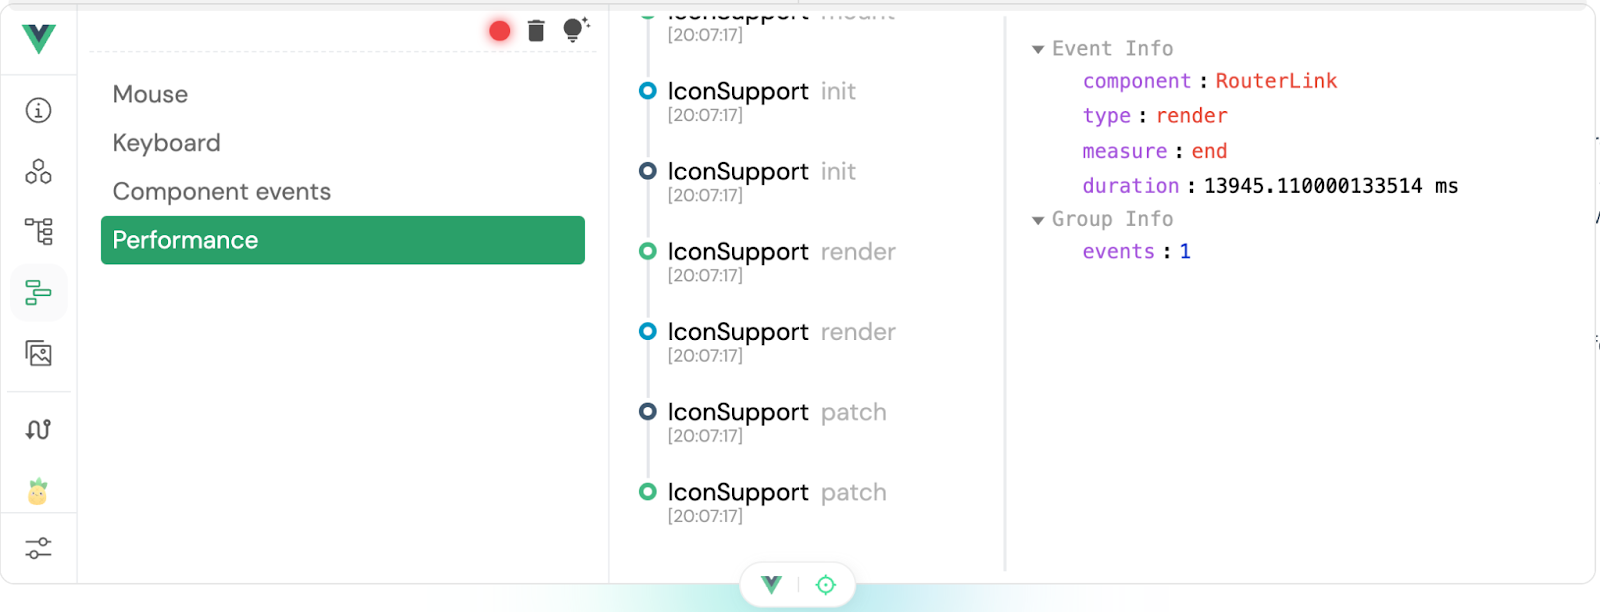
This should give us important information about how much time it takes for certain components to perform certain operations so that we can discover performance bottlenecks and try to solve them efficiently.
Going further, we have an Assets tab responsible for displaying information about the assets located in the root directory, /public , or src/assets.
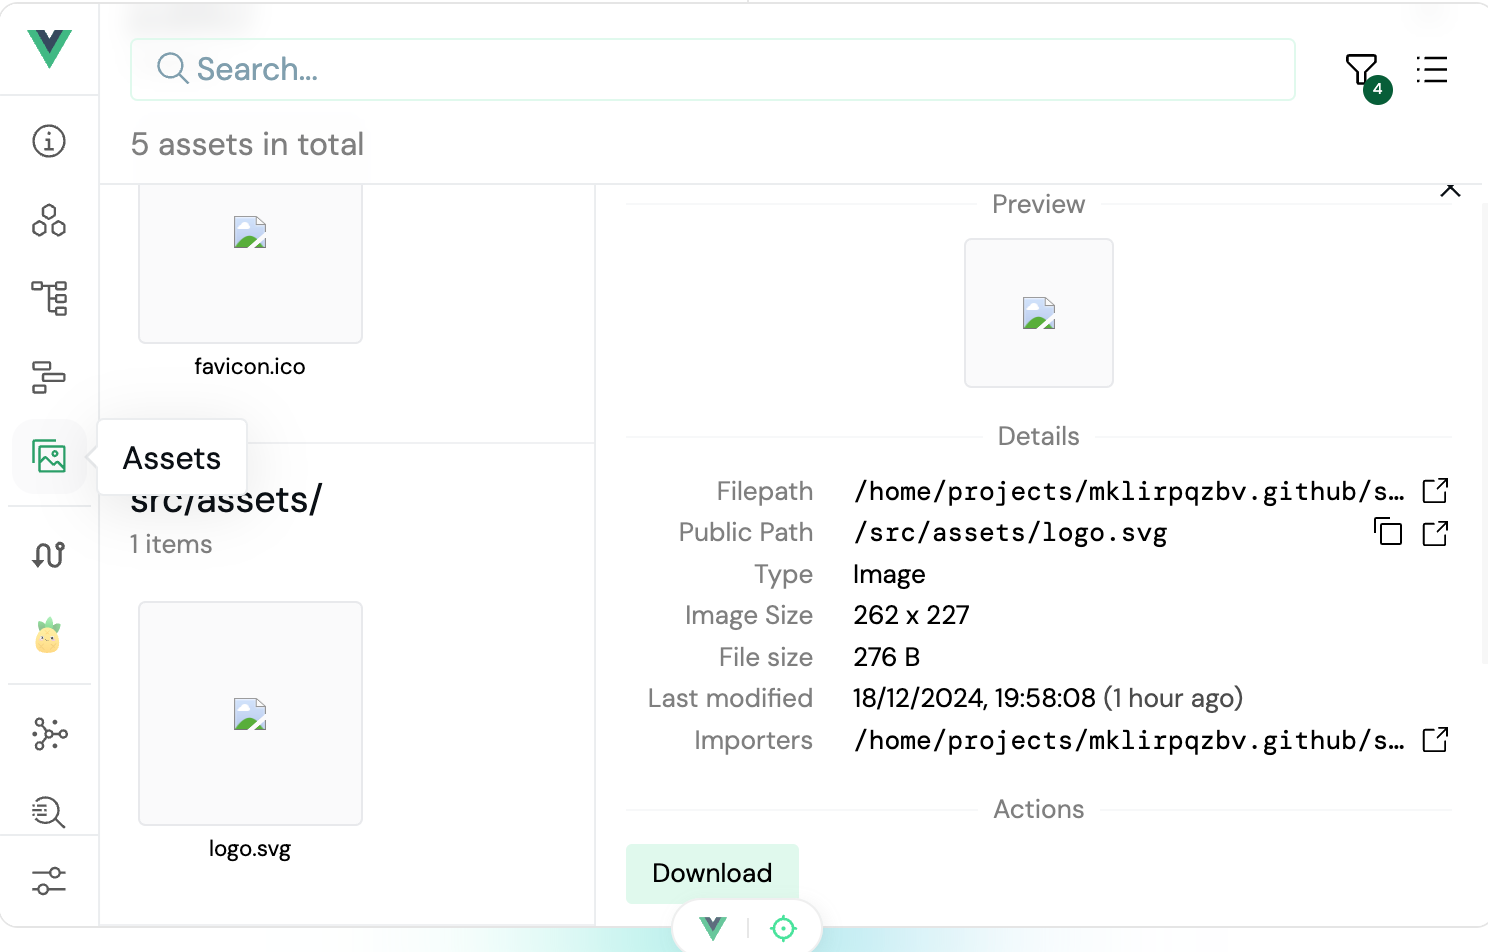
We can use this information to investigate the size of the files that we use in our application without any transformations like images.
The next interesting place that could help us measure performance of our Vue application is the Graph tab which can be located on the navigation bar as shown below:
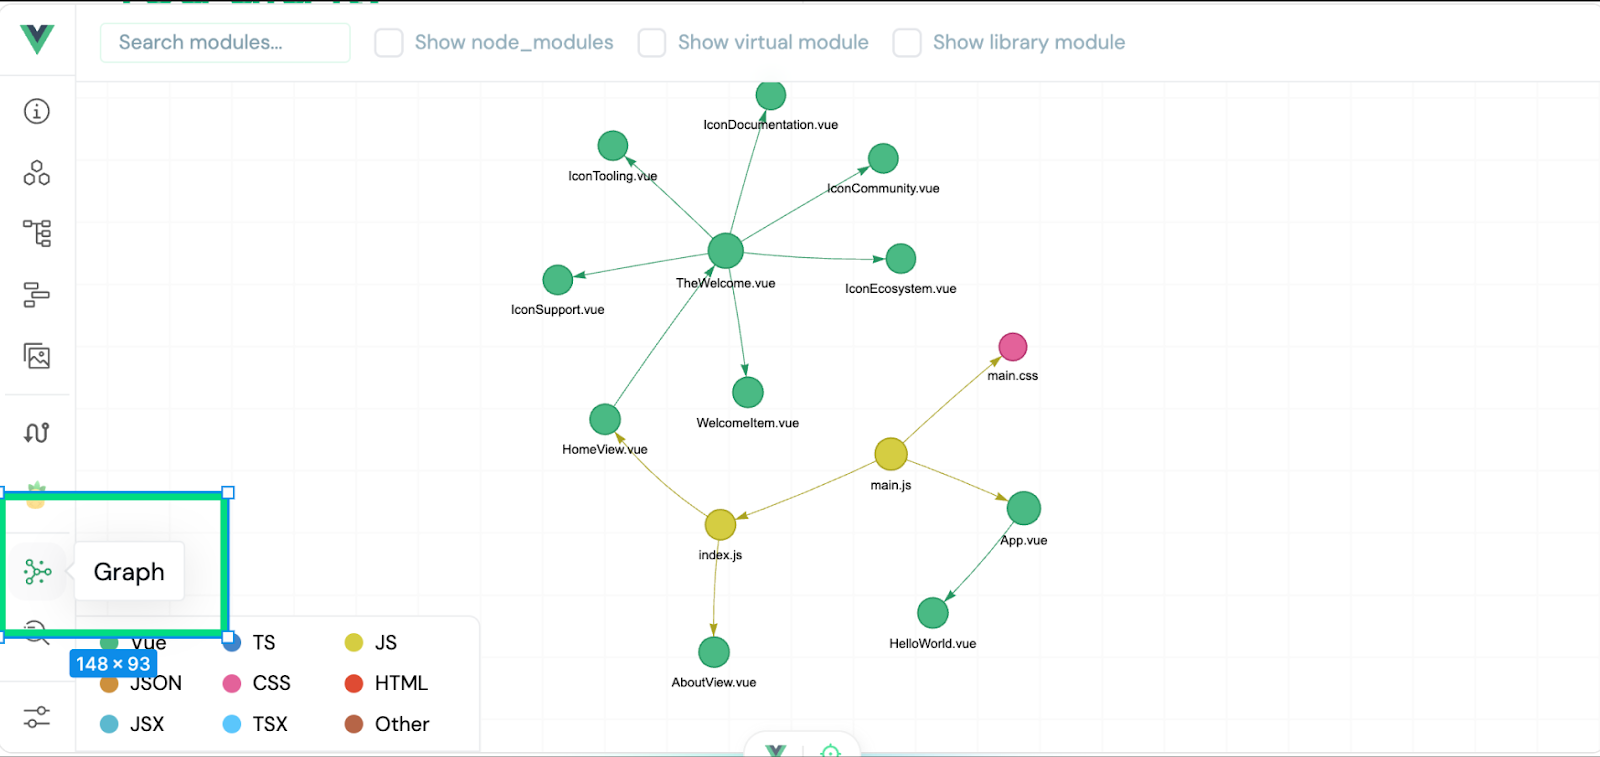
This tab will show us how certain Vue components, JavaScript/TypeScript files, and stylesheets are connected to each other. We can investigate relationships between components and eliminate not unnecessary connections that will block proper dynamic loading of these elements.
The next feature tab that we will use to investigate performance is the Vite Inspect tab located on the left side of the navigation bar as shown below:
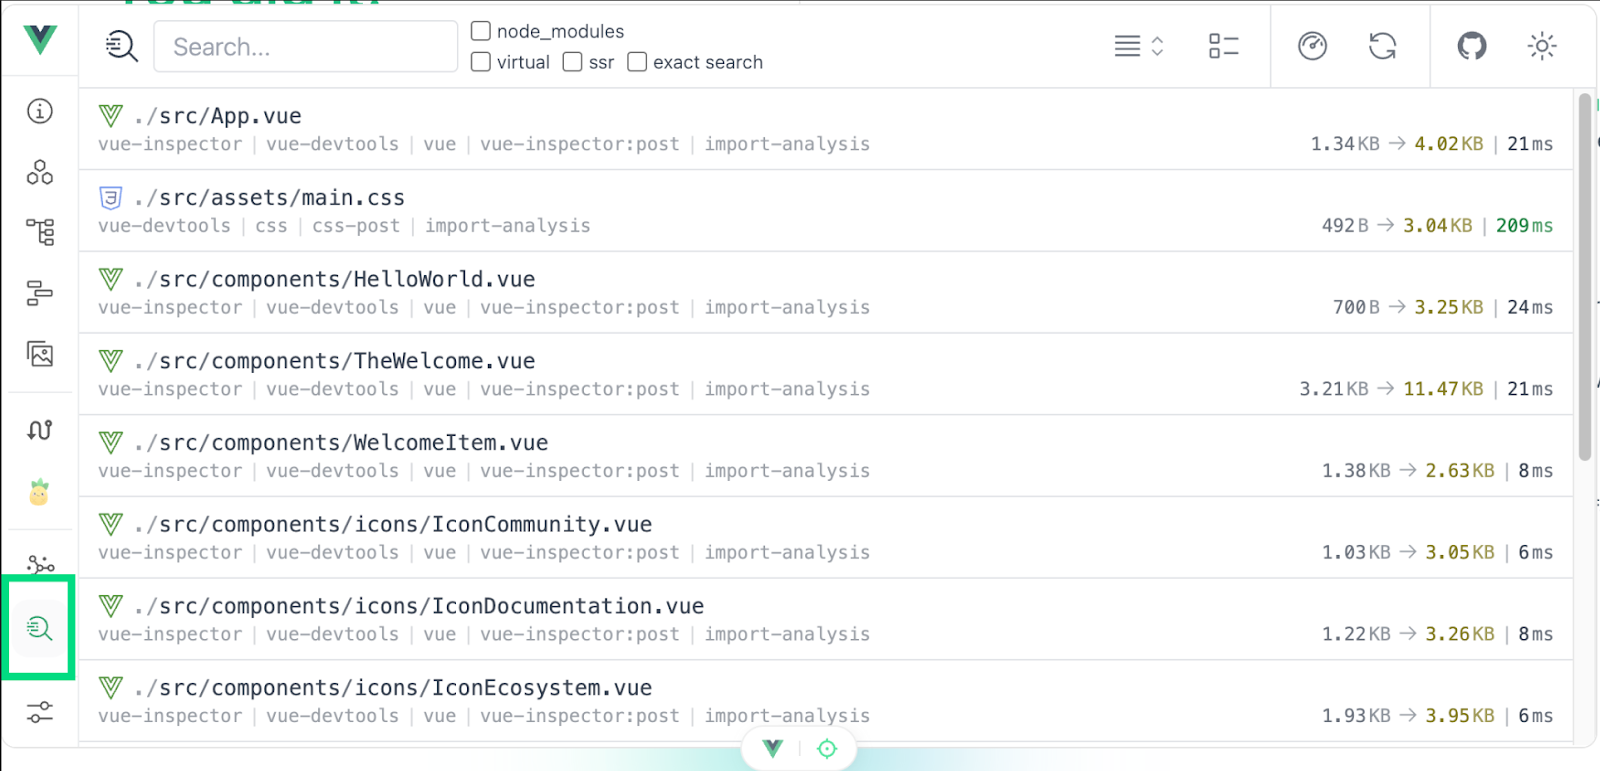
It lists all the files that our Vue application uses with their size and the time needed to evaluate them. In the screenshot above, we can clearly see that even though there are files that are heavier, it is the stylesheet file that takes the most time to be evaluated.
In this page, we can also click the Metrics button located in the top right corner.
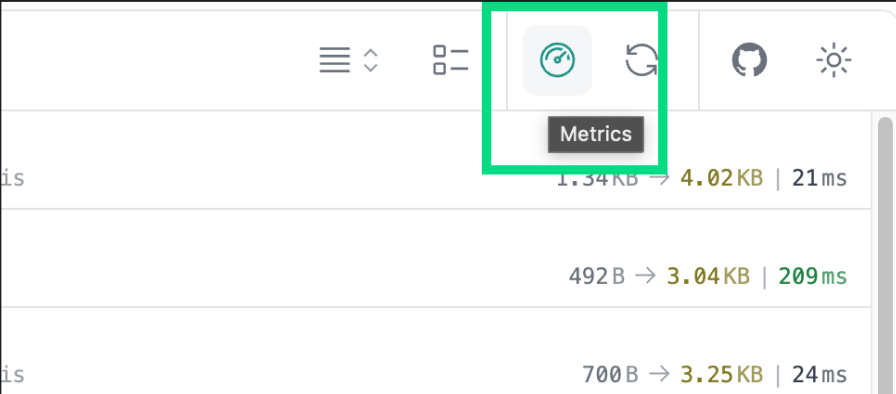
This will open up an aside tab with the information about average and total time needed for certain Vite lifecycle hooks to run.
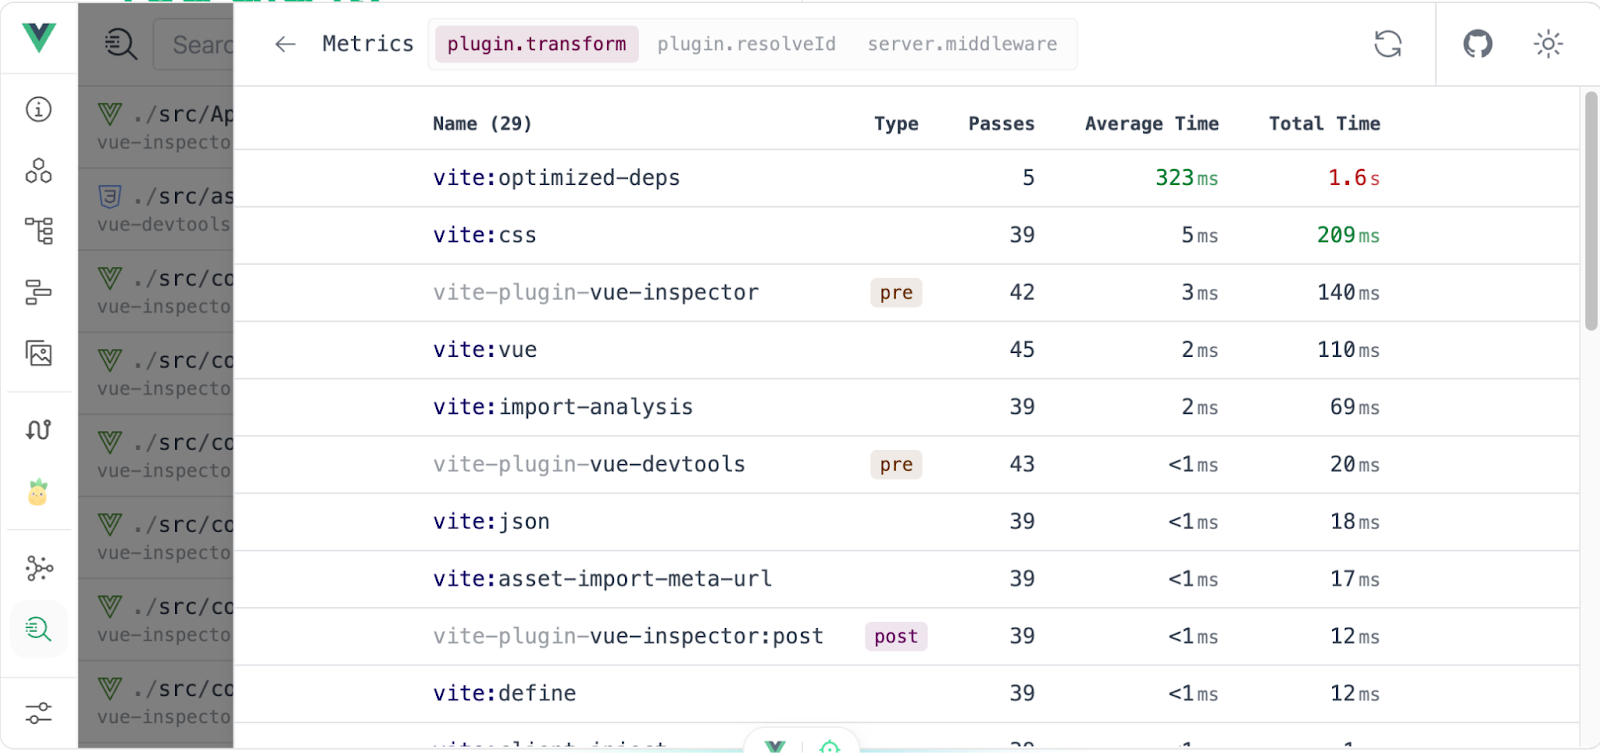
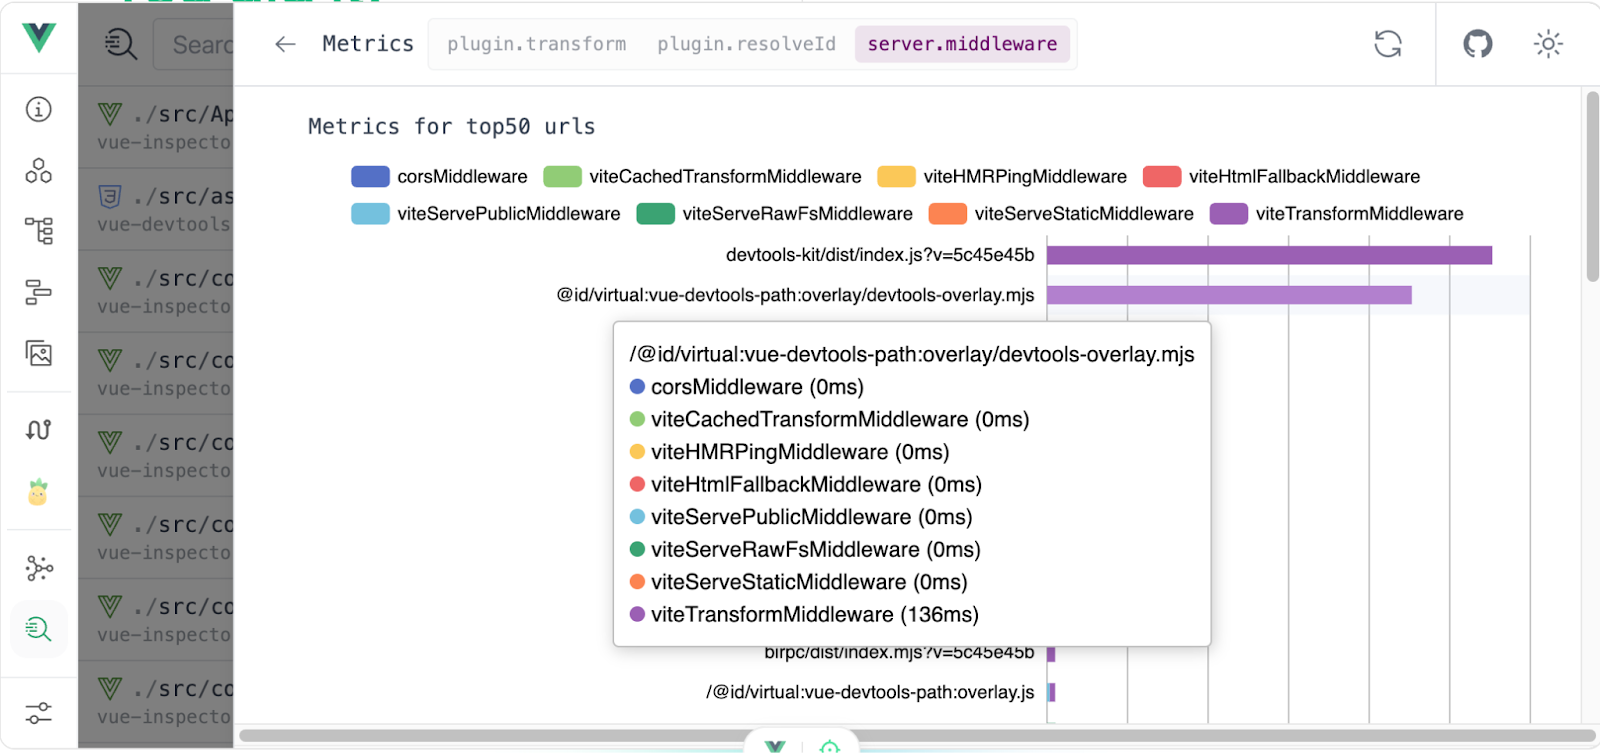
We can also investigate how much time it takes for certain middlewares to run in our Vue (powered by Vite) application.
Performance improvements based on insights from Vue Devtools
To best utilize Vue Devtools for performance monitoring, make sure to integrate performance checks into the development phase to avoid issues later on in production. There are a few performance improvements that we can implement based on insights from Vue Devtools:
- Preventing static content from unneeded re-rendering with the usage of
v-oncedirective. - Ensuring that components re-render only when their props or state changes.
- If your app has large nested trees of dependencies, focus on optimizing the component hierarchy to reduce updates with usage of
shallowRef - Deferring loading unneeded components with the use of dynamically loaded (lazy/async) components.
- Caching computed properties or calculations with the use of memoization.
There are multiple other ways how we can improve performance of Vue applications and you can check it out in our other article here.
Summary
Vue Devtools is a vital tool for Vue developers, enabling efficient debugging, improving development workflows, and enhancing overall productivity. By using the Vue Devtools package, developers can harness the same debugging features available in the browser extension, regardless of the environment in which their Vue application is running.
Vue Devtools helps developers investigate performance bottlenecks in Vue applications by the usage of features like live editing, time travel debugging and component inspection. If we add to it additional features like Assets and Vite inspections we receive a powerful tool to help us measure and improve performance of Vue applications continuously.
Additional resources
If you would like to learn more about these concepts, please check out the following articles and videos: