Data for the Largest Contentful Paint metric often varies significantly between lab-based synthetic tests and real user data.
In this article we'll take a look at what causes these discrepancies and how to interpret them.
What are lab and field data?
Website performance can be measured in a two ways:
- Lab data: In a controlled lab environment, with a fixed network and device type
- Field data: By measuring how fast a website is for real users
Lab data is very detailed and can be collected on demand. But unlike field data it doesn't tell you how your visitors actually experience your website.
Field data tells you how fast your website is in practice, and it's also used by Google as a search result ranking factor. But it often doesn't provide the same depth for debugging performance issues as lab data does.
Many tools, like PageSpeed Insights, report both lab and field data.
Run A Free Page Speed Test
Test Your Website:
- No Login Required
- Automated Recommendations
- Google SEO Assessment
CrUX data
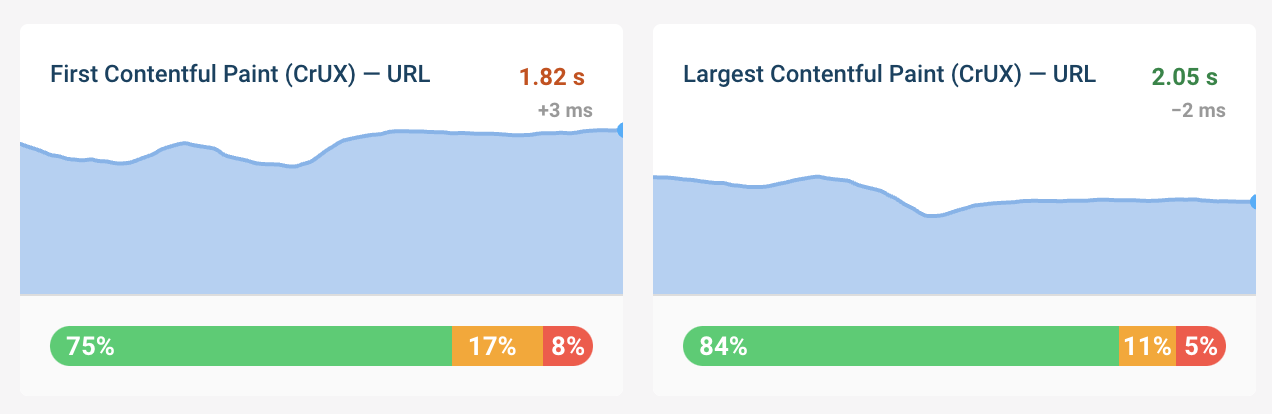
Google's Chrome User Experience Report (CrUX) is a type of field data. It's collected from real Chrome users who are opted into additional statistics reporting.
Unlike full real user monitoring, CrUX data is always reported as a 28-day rolling average. That means it will take 28 days for the data to fully update.
What causes LCP discrepancies between lab and field data?
There are a number of factors that cause the LCP metric in field data to not match what's reported in a lab-based report:
- Different network speeds
- Different CPU speeds
- Different device sizes
- First load vs subsequent visits
- Logged-out versus logged-in experience
- CrUX data delay
- Caching differences
Network speeds in lab and field data
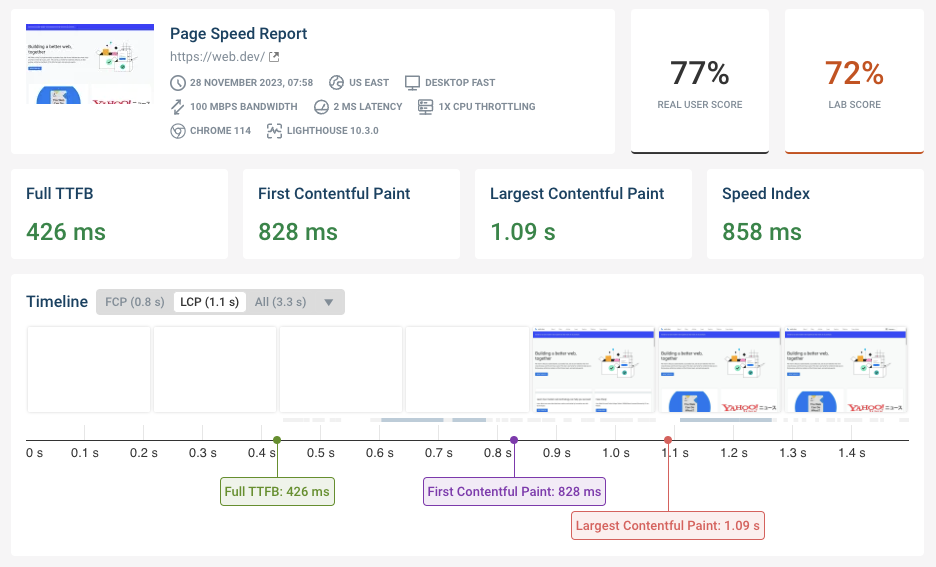
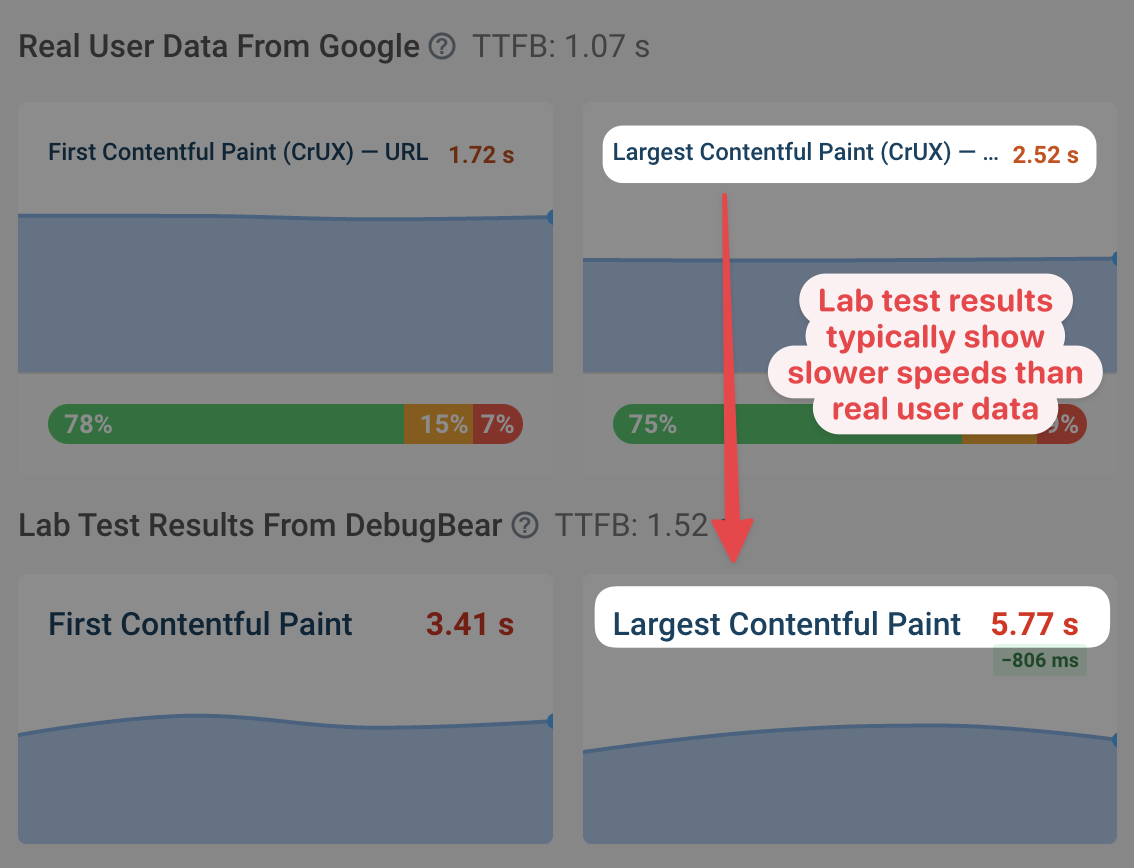
Lab-based tests always use a predefined fixed network speed. For example, a typical mobile lab test with Lighthouse or PageSpeed insights is run on a connection with a bandwidth of 1.6 megabits per second and a round trip time of 150 milliseconds.
These speeds are typically a lot slower than what's available to the average website visitor. Because of that, you should expect LCP to be worse in the lab than in the field.
Differences in CPU speed
The processor speed of the device loading the website can have a big impact on the Largest Contentful Paint metric, especially if your website uses a lot of JavaScript code.
You may find that lab data reports slower execution times compared to field data, if your visitors mostly use fast devices. However, if your visitors come from places where many people don't have high-end devices, you may see that real user data is worse than the lab test results.
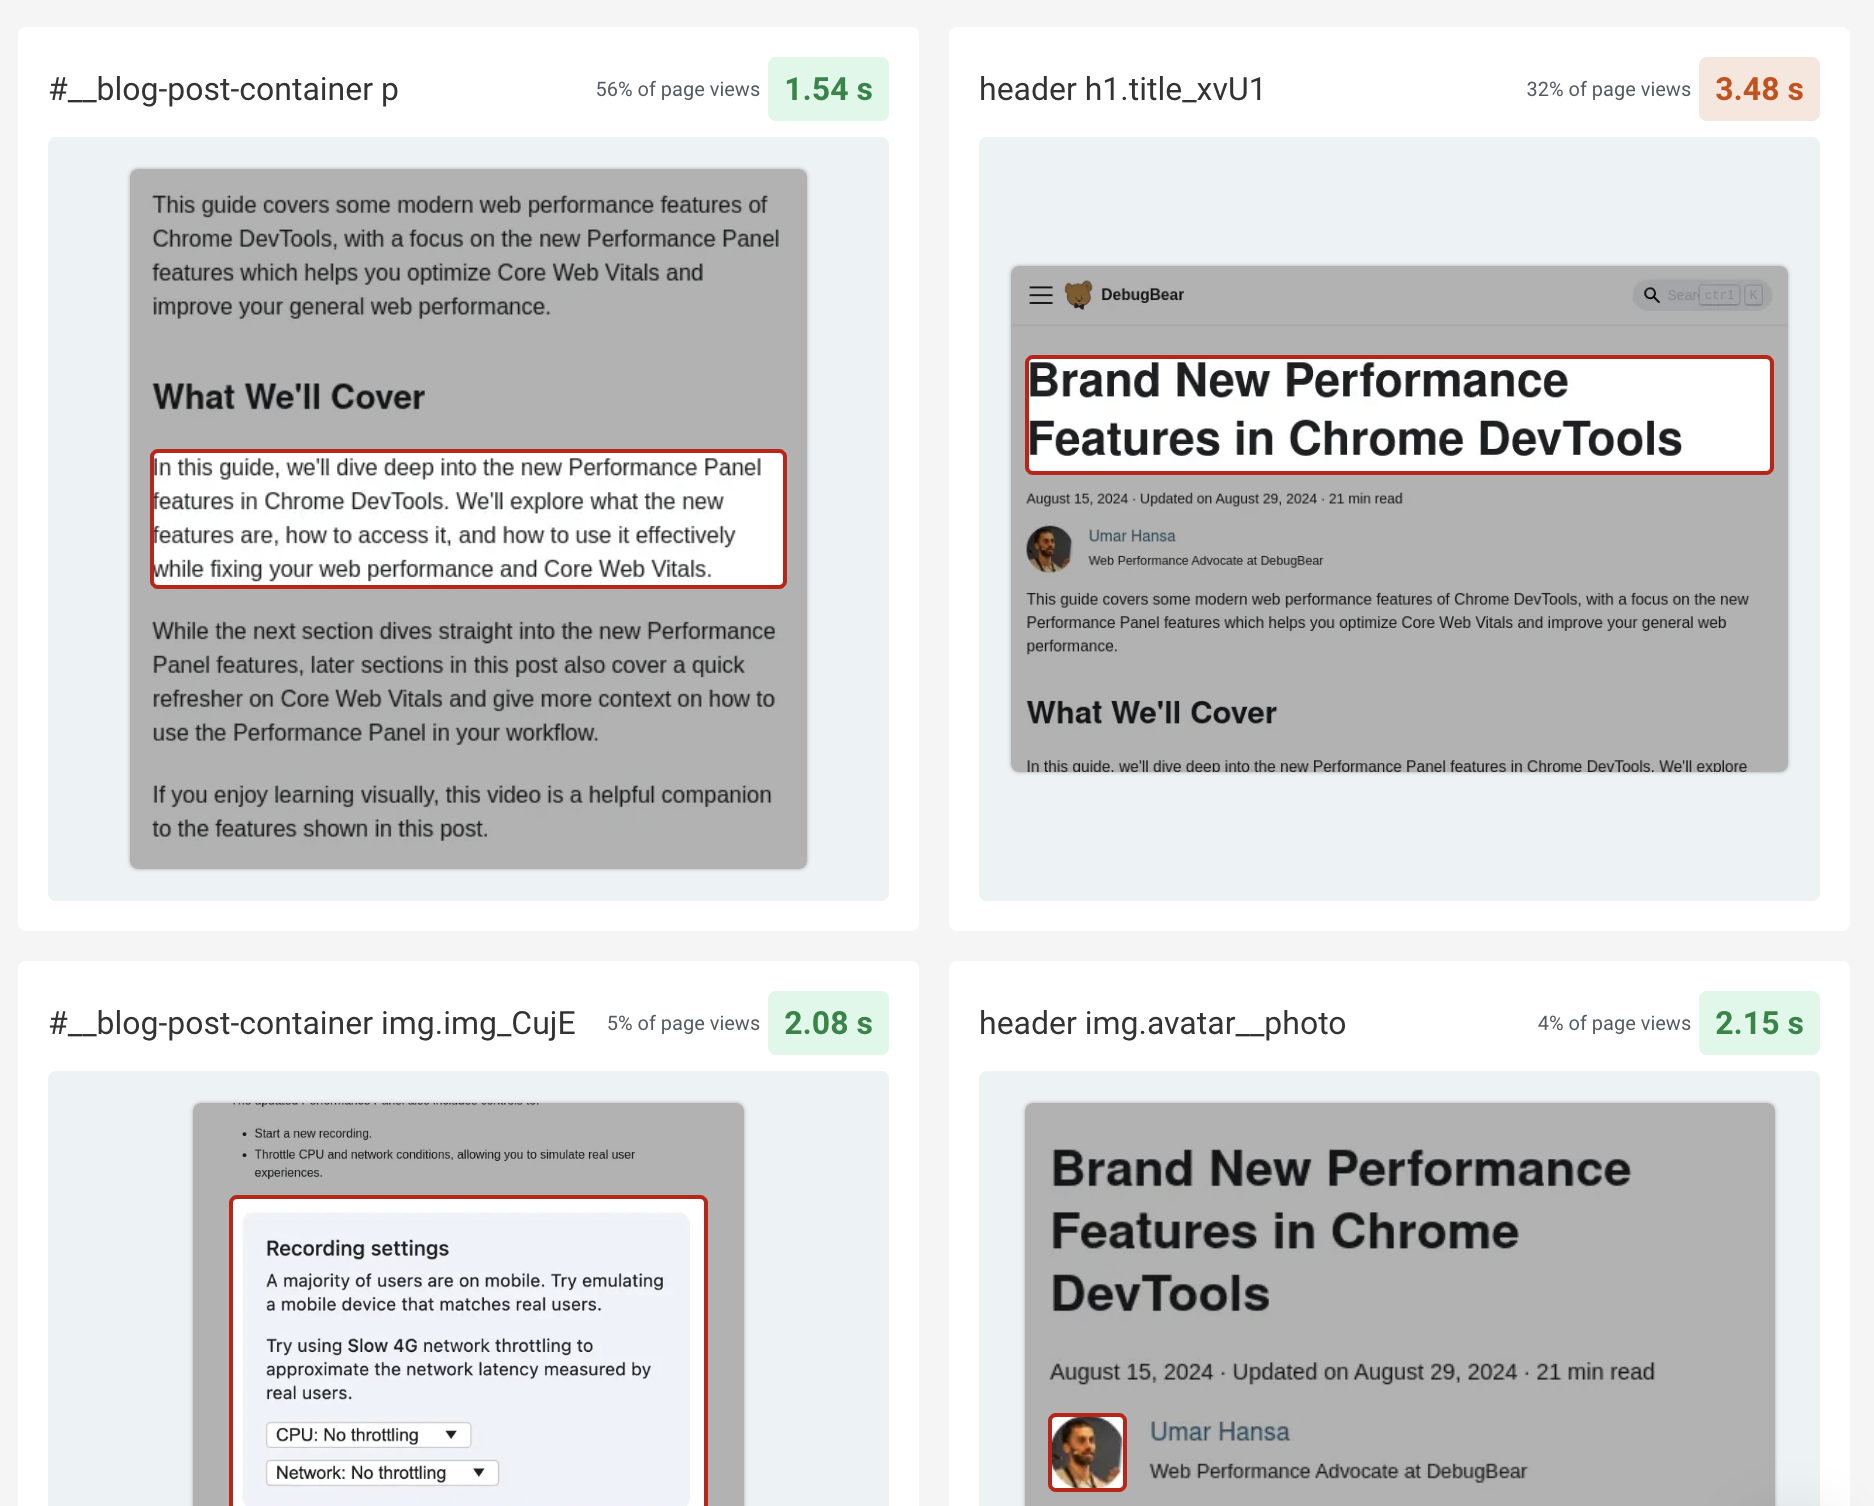
Differences in device size
How large the screen of a visitor is will determine what content they can see after opening your website. It also determines the size that different page elements are rendered at.
Due to this variation, the page element that's responsible for the Largest Contentful Paint also varies.
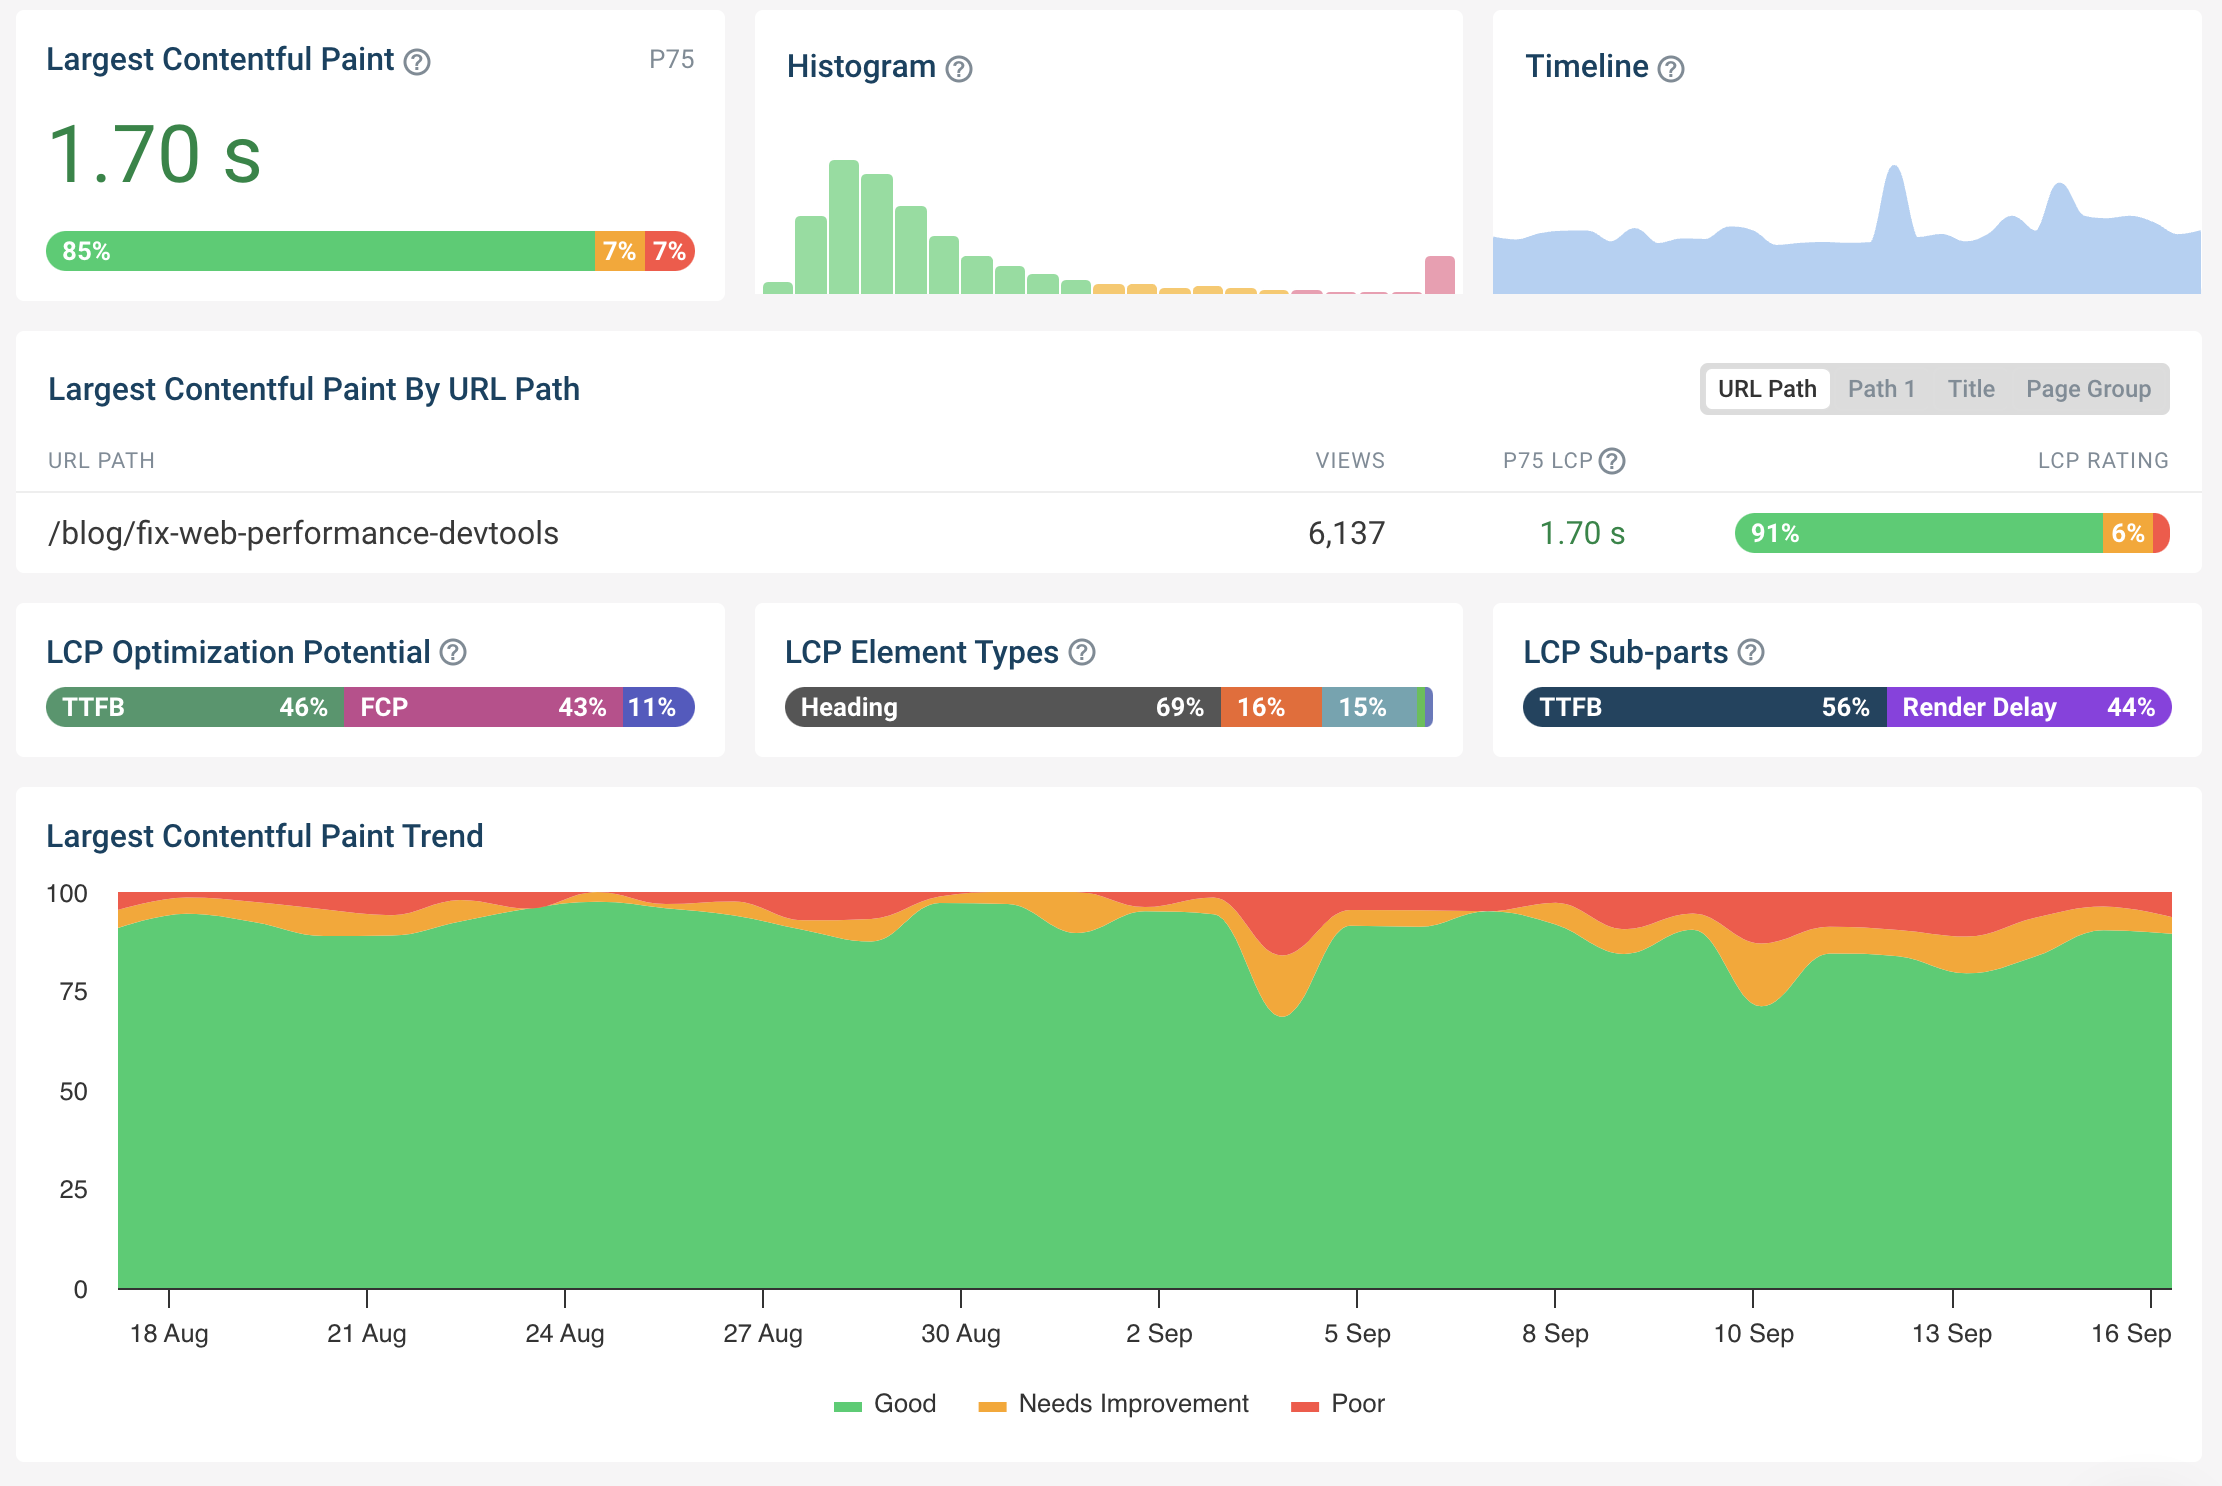
Using a real user monitoring tool can help here, as it will be able to tell you how often different page elements are identified as the LCP element, and how that impacts the LCP metric.
First load versus subsequent visits
Many lab-based tools focus on the first experience a visitor has when arriving on your website. This is called a "cold load", where nothing is cached and no server connections can be reused.
However, many of your real visitors will navigate around different pages on your website. Therefore, efficient caching often has a big positive impact on field metrics.
For the first visit, users will often see cookie banners and consent management dialogs, which often have greatly different performance characteristics compared to a typical page view.
You can use a tool like DebugBear to test warm loads in the lab, as well as test your website with cookies enabled or disabled.
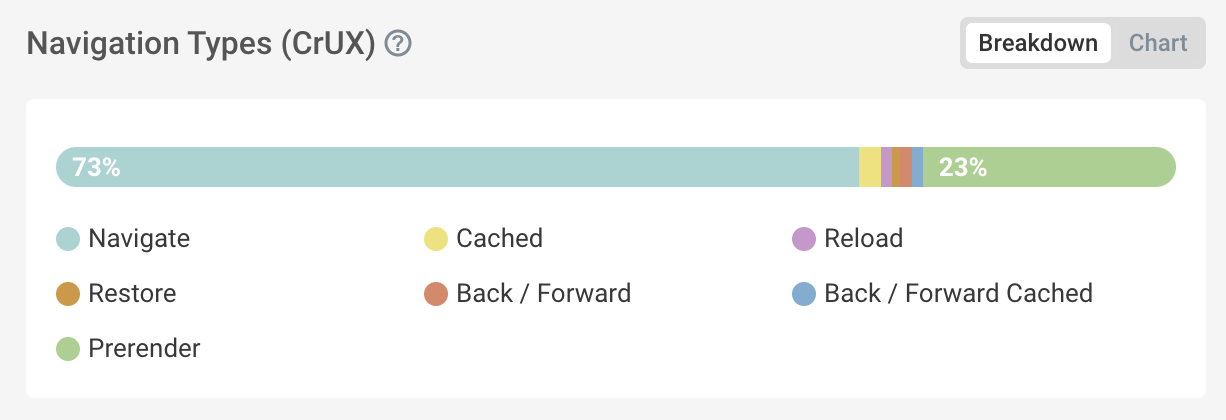
In addition to the HTTP request cache in the browser, real users may also benefit from the back/forward cache when navigating around your website. You can check the Web Vitals tab in DebugBear to see how often pages are served from the back/forward cache for real users.
Content variation between logged-in and logged-out users
Lab tests typically just visit a website, without first logging in. Typically that leads to a faster user experience:
- For logged-out users there's no need to customize the website to user preferences or to show their data
- Logged-out page content is the same for a large number of visitors, and can therefore be cached
If you want to test logged-in pages in a lab environment you can set up a login flow that runs prior to the website speed test.
CrUX data delay
Google provides easily accessible real user data for a large number of websites. While this is convenient, the data is aggregated over a 28-day period.
Therefore, if your field data doesn't match lab data, that may simply be because there was a recent change on your website that's not reflected in the CrUX report yet.
Real user monitoring (RUM) data does not have the same issues as CrUX data, and therefore lets you see more quickly how website changes are impacting your field metrics.
Caching differences
We've already seen that warm loads and caching in the browser can lead to better load times in real user data compared to lab results.
However, caching in the server or CDN edge node can also positively impact lab tests when real users don't have a good experience. That's especially the case when lab tests are run repeatedly from the same location.
Let's say a file is cached for 30 minutes on either a CDN or on your server. If you run a bunch of lab tests on your website this will warm up the server-side cache, resulting on good test results in your lab data.
However, if a page on your website only gets a few page views a day it is unlikely to be served from the cache for the average user.
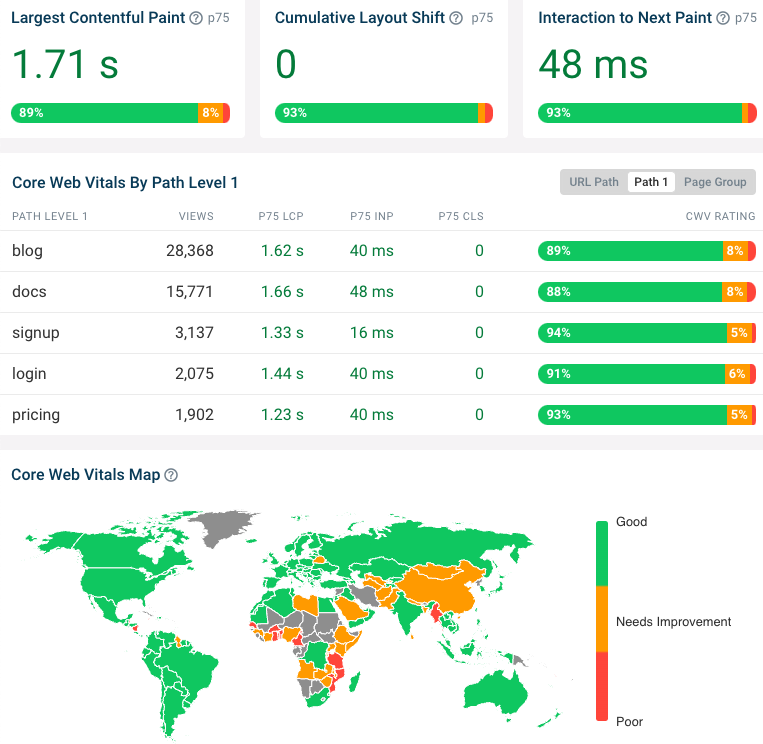
To find out if this is impacting your LCP score, take a look at the Time to First Byte metric. If this metric is worse for real visitors that usually means there's a caching issue.
How do I deal with lab and field data not matching?
Generally seeing a mismatch between lab and field metrics isn't a problem. While you can adjust your test device settings to match your real users more closely, ultimately what matters is that you can identify whether you have a problem and what could be done to fix it.
With lab data you can track your metrics over time, get alerted immediately when there's a performance regression, and investigate what's the cause of a change.
If you find that optimizations that work in the lab aren't working in the field you can take a deeper look at real user monitoring data to find out how the lab results differ from real visitor experiences.
Monitor Page Speed & Core Web Vitals
DebugBear monitoring includes:
- In-depth Page Speed Reports
- Automated Recommendations
- Real User Analytics Data