Lighthouse (LH) is a free, open-source website analysis tool from Google that allows you to generate a report, which includes a list of audits that evaluate how well a web page scores on various signals.
In this post, we'll look into what Lighthouse audits are, why you often get different results for the same performance audit, and how you can generate LH reports in different environments.
The Four Categories of a Lighthouse Report
Lighthouse is a JavaScript API that allows you to conduct synthetic (a.k.a. lab) tests in different browsing environments, including networking conditions, operating systems, latency, device characteristics (e.g. CPU, memory, etc.), browser version, and more.
The output of a LH test run is the Lighthouse report, which has four categories:
- Performance
- Accessibility
- Best Practices
- SEO
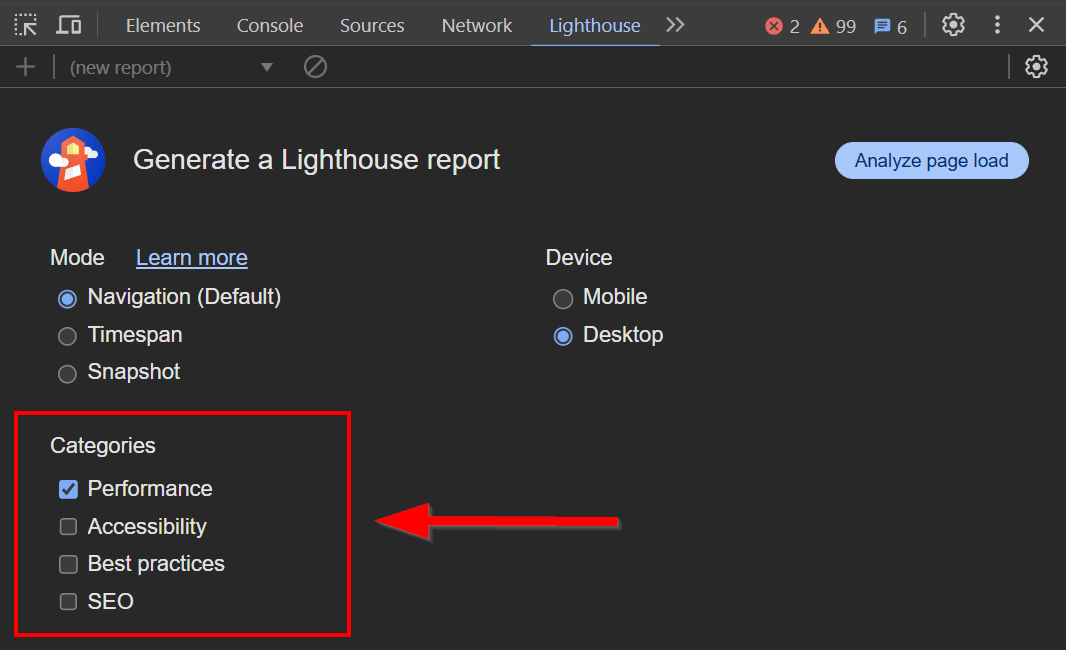
Each category includes an overall score and a list of audits. You can decide which categories you want to include in the report.
For example, in the screenshot below, I only selected the Performance category since this article is about Lighthouse's performance audits:

While this post is about Lighthouse's performance audits, you can learn more about other LH categories by checking out our articles below:
What Are Lighthouse's Performance Audits?
The Performance category of a Lighthouse report consists of:
- a Metrics section that shows a summary of your most important web performance scores, including the Lighthouse Performance score and Web Vitals that can be measured in the lab, under simulated conditions (some Web Vitals can only be accurately measured by monitoring real user behavior)
- an overview of the Lighthouse Treemap
- the audits section, split into two parts:
- Diagnostics where LH shows all the audits the page hasn't passed or needs attention for another reason
- Passed Audits sections where LH shows all the audits the page has passed
The Performance category currently has 38 audits, each evaluating the page for a distinct web performance signal.
To learn more about how to score well for the individual signals, check out some or all of our articles on the following LH Performance audits:
- Avoid enormous network payloads
- Reduce JavaScript execution time
- Defer offscreen images
- Reduce unused JavaScript
- Minify CSS; Minify JavaScript
- Avoid an excessive DOM size
- Enable text compression
- Eliminate render-blocking resources
... and more to come — to get notified about our posts, sign up for our monthly web performance newsletter (we never send spam).
Lighthouse Flags: Green, Grey, Yellow, Red
Lighthouse flags each audit using a color-coded rating system — similar to (but not the same as) the one used for Core Web Vitals, according to the following logic:
- Shown in the Diagnostics section:
- Red flag: It signifies a poor result, meaning it's highly recommended that you make immediate improvements.
- Yellow flag: It represents a mediocre result, meaning it's recommended that you make improvements.
- Grey flag: It means that while the page passes the audit successfully, it's still recommended that you keep an eye on (and if possible improve) the result.
- Shown in the Passed Audits section:
- Green flag: It indicates that the page passes the audit successfully and no further attention is needed.
However, not all Lighthouse audits assign all four flags.
For example, during the tests I ran for my 10 Steps to Avoid Enormous Network Payloads article, I found that for the Avoid enormous network payloads audit, you can only receive either the grey or yellow flag (i.e. grey means success while yellow means failure).
To learn more about these results, jump to the details. Overall, it seems that certain key signals (e.g. network payloads) can only trigger the grey info flag, and not the green one, which means that the audit will never be listed under the Passed Audits section.
This likely indicates that you are supposed to constantly work on improving these areas. However, note that this is just an assumption, and neither Google nor the Lighthouse team clearly states this in their documentation.
Why Does the Same Lighthouse Audit Yield Different Results?
You can run Lighthouse in a couple of different ways, meaning you can generate LH reports with different tools.
The most frequently used ones are:
- Chrome DevTools:
- It allows you to run LH locally, in your own browsing environment.
- You can moderately control the environment, e.g. you can change the networking conditions, generate the report from different devices, or choose between simulated and advanced throttling.
- PageSpeed Insights (PSI):
- It allows you to run LH remotely, on Google's servers.
- The environment is completely controlled by Google.
- Custom Lighthouse dashboards, such as DebugBear:
- It allows you to run LH remotely in completely customizable browsing environments from different test locations.
- You can control multiple aspects of the environment and collect custom data so you can see historical trends and compare results.
The same Lighthouse audit (e.g. Avoid enormous network payloads) run around the same time (so changes in code can be excluded), often yields varying results because you're running the API in different environments, either by using different LH tools or changing the test conditions.
In addition to variations in the environment, such as hardware, connection type, OS, browser version, etc., there can also be differences in the dynamic content the page loads for different users, such as ads or legally required scripts (e.g. cookie notices and GDPR consent forms for European users). Larger sites frequently show more or less different content for users in different countries, too.
Now, let's see how the outcome of Lighthouse audits varies when using different tools (which also means variation in the environment).
Below, I'll compare the results of the Avoid enormous network payloads audit generated for Booking.com's homepage on desktop by three Lighthouse tools. However, this kind of variability applies to all other LH audits as well.
To learn more about the variability of Lighthouse tests, check out our Why Are Lighthouse and PageSpeed Insights Scores Different? article, too!
1. Local Lighthouse Audits in Chrome DevTools
To run Lighthouse locally, open Developer Tools in the Chrome browser (by hitting the F12 key), navigate to the Lighthouse tab, and click the Analyze page load button.
This will run a Lighthouse report on the web page open in the same browser tab.
Run the LH report in Incognito mode, which automatically disables all your browser extensions, so they won't skew the results. You can do so by clicking the three-dots icon in Google Chrome and selecting New Incognito Window from the dropdown menu.
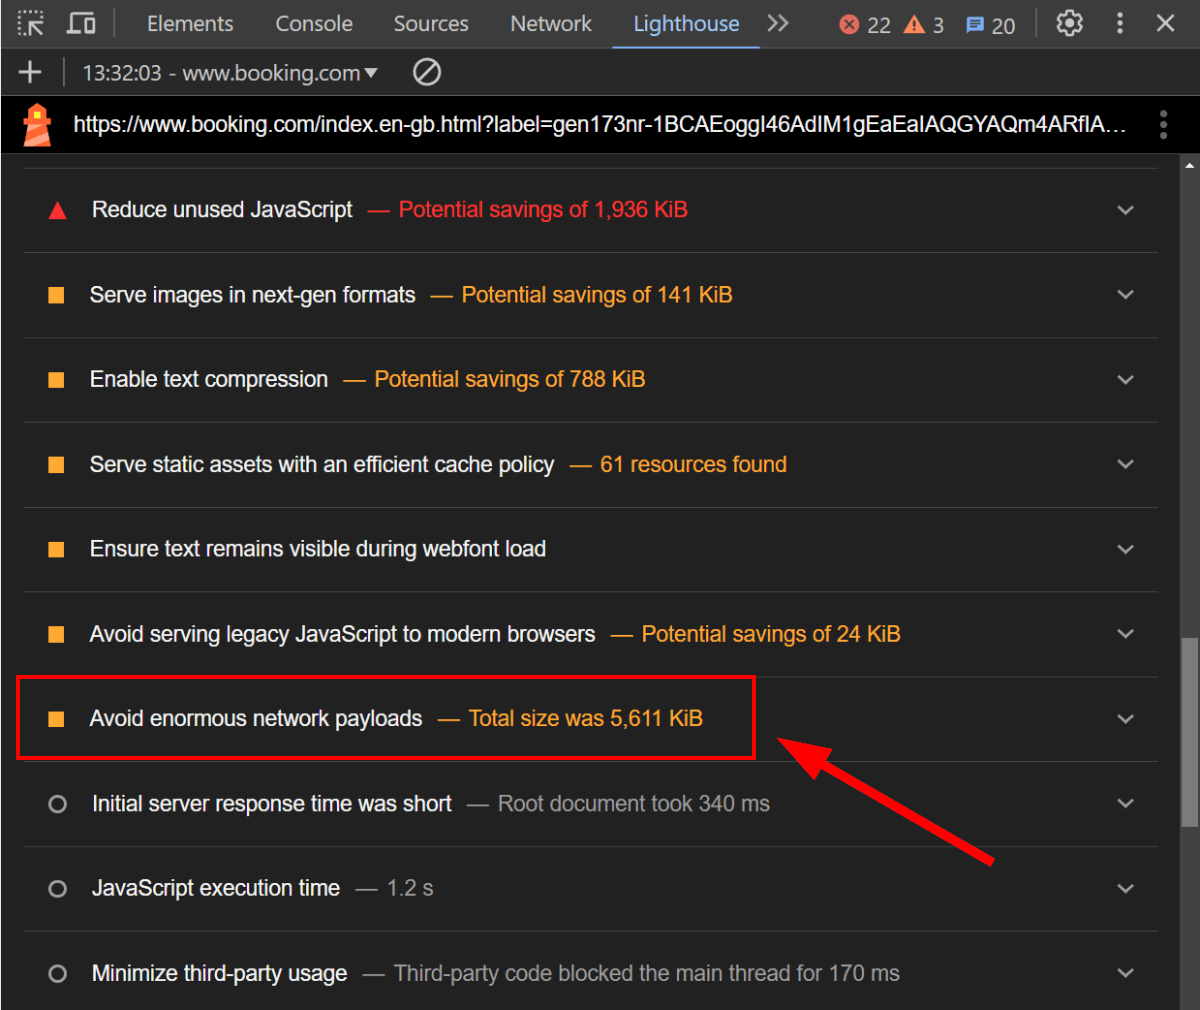
As you can see below, in the local Lighthouse test run from my own machine in Europe, Booking.com's homepage received a yellow score for the Avoid enormous network payloads audit, and the total size of the network payload was 5,611 KB:

2. Remote Lighthouse Audits in PageSpeed Insights
You can run Lighthouse remotely using Google's PageSpeed Insights (PSI) web app, which allows you to test web pages on Google's servers.
PSI shows two types of results:
- At the top of the PSI report, you can see the aggregated web performance scores from Google's Chrome User Experience (CrUX) Report, which has been collected on real Chrome users throughout the previous 28 days.
- At the bottom of the PSI report, PageSpeed Insights shows the results of the Lighthouse report generated from the current remote lab test.
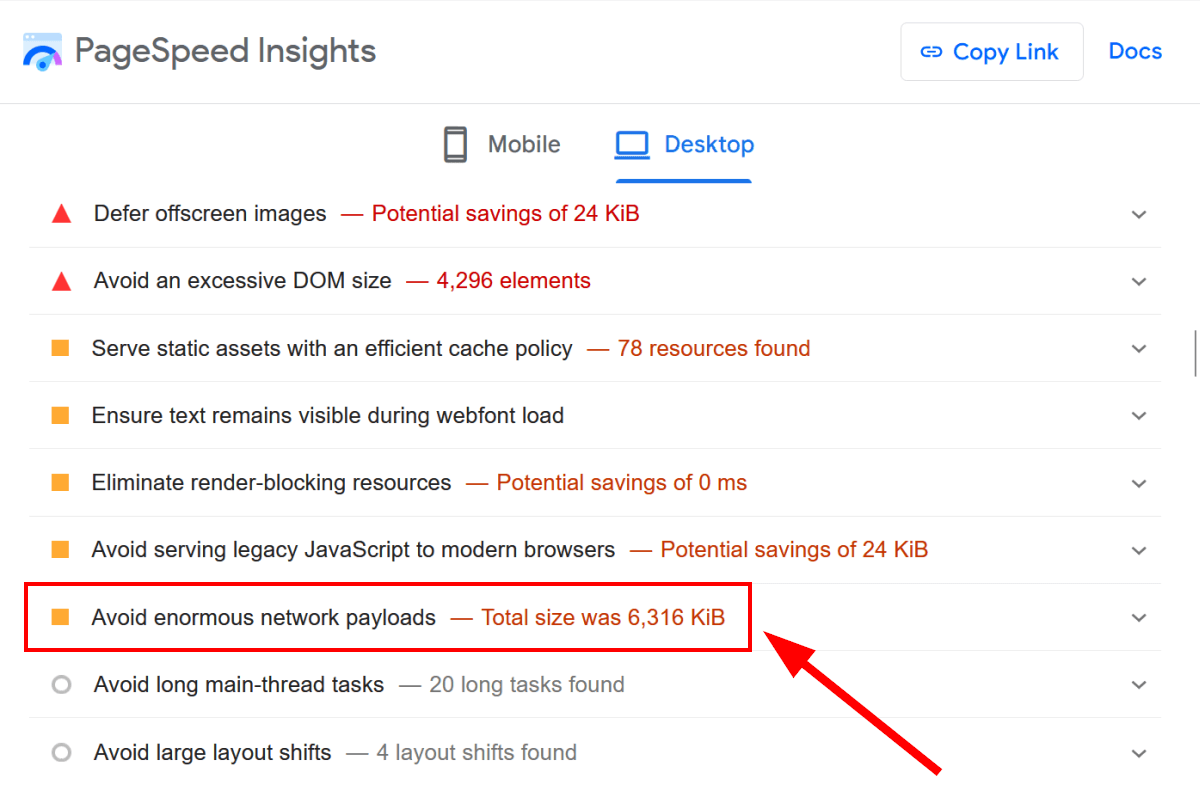
In the screenshot below, you can see some of Lighthouse's performance audits from the PSI test run for Booking.com's homepage on desktop.
As expected, the total size shown for the Avoid Enormous Network Payloads audit (6,316 KB) is different from the result of the local Lighthouse test in Chrome DevTools (5,611 KB), which exemplifies the variability of Lighthouse's performance audits (the difference is 12.56% in this particular case):

3. Custom Lighthouse Audits in DebugBear
In addition to Chrome DevTools and PageSpeed Insights, you can also use a Lighthouse-based web performance auditing tool such as DebugBear, which allows you to set up completely custom environments for remote Lighthouse tests.
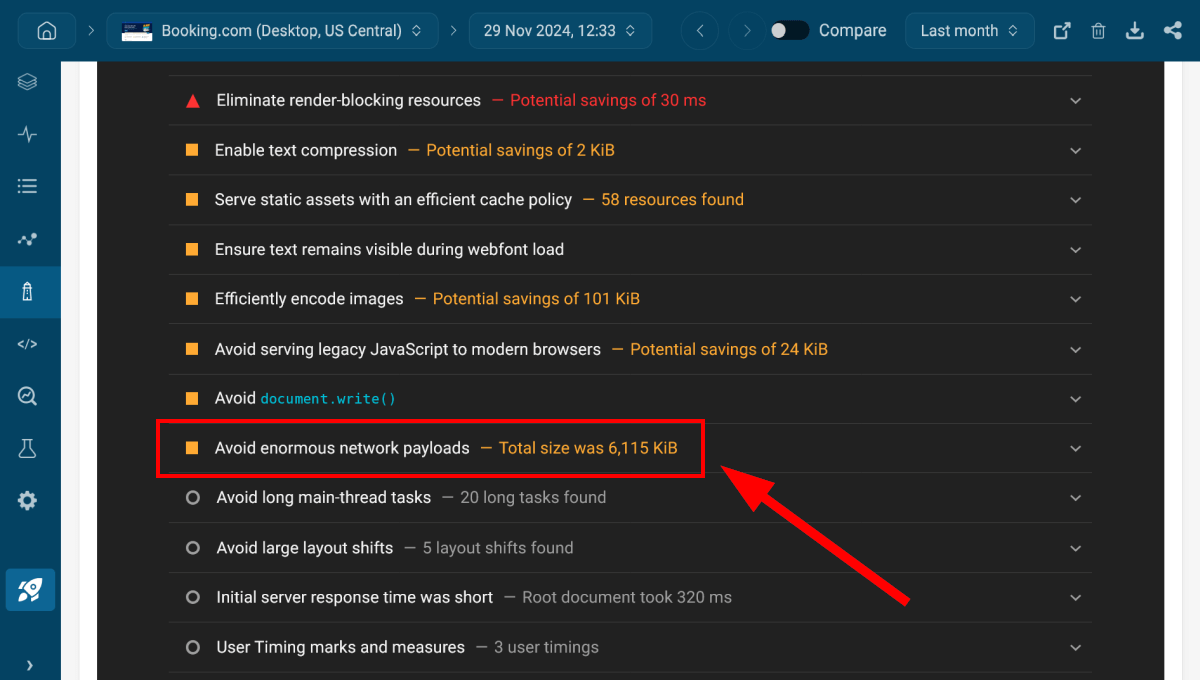
For the screenshot below, I tested Booking.com's homepage on desktop from our US Central test location in Iowa, using an 8 Mbps bandwidth connection, a 40 ms roundtrip time, and 1x throttling.
As you can see, the Avoid enormous network payloads audit scored 6,115 KB on the DebugBear test using the above conditions, which means an 8.98% increase compared to the local LH test and a 3.18% decrease compared to the PSI test:

Wrapping Up
Lighthouse's performance audits give you a comprehensive overview of the key web performance signals you need to watch and improve.
LH tests conducted under different conditions and using different tools show some variability (~ +/- 3 – 13% in the example above). While this is natural to a certain extent, it can also help you better understand your results for Lighthouse's various performance audits, as it enables you to compare different results.
DebugBear allows you to set up completely customizable environments for your Lighthouse reports, monitor key web pages over the long term, collect and compare historical web performance data, and more.
To get started with advanced Lighthouse tests, take a look at our interactive demo, check your most important pages with our free website speed test tool, or sign up for our fully functional 14-day free trial (no credit card required).