The DOMContentLoaded event has been around for a long time and has often been used as a web performance metric. However today it has mostly been replaced by more modern user-focussed metrics like the Core Web Vitals.
In this article we take a look at the DOMContentLoaded event, when it fires, how to measure it, and whether you should still be relying on it today.
What is the DOMContentLoaded event?
The DOMContentLoaded event is a browser event that is fired on the document object of a website. That means event handlers can be added using JavaScript, and pages can run code in response to the event firing.
DOMContentLoaded occurs as part of the page load process, so it is also used as web performance metric to measure how quickly the page loads.
document.addEventListener("DOMContentLoaded", function () {
  /* Event Handler */
});
When does the DOMContentLoaded event fire?
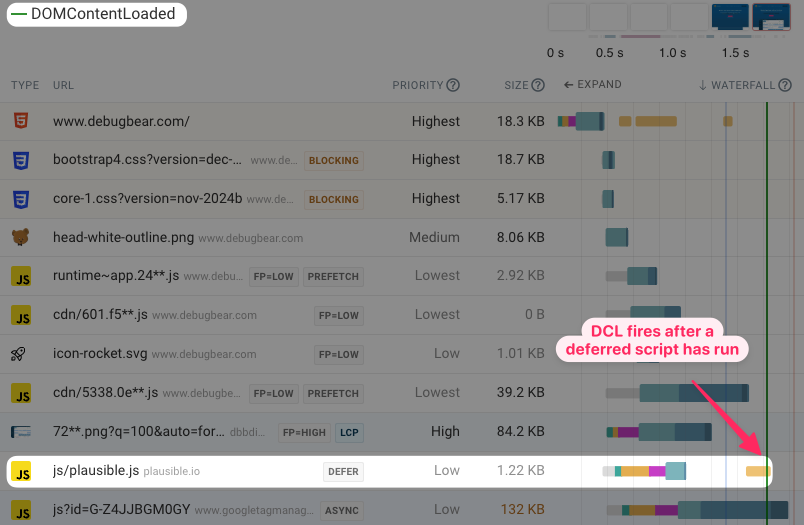
The DOMContentLoaded event fires after the HTML document has been parsed. Usually that means after the closing </html> has been reached. DOMContentLoaded also fires after deferred scripts have been run.
Inline and synchronous scripts in the document block the HTML parser, so they also delay the DOMContentLoaded event.
This request waterfall screenshots shows an example of when the DOMContentLoaded event fires, after loading and running a deferred script.
How is DOMContentLoaded different from the Load event?
The Load event fires after page resources like stylesheets, images, and scripts (even async ones) have been loaded. Therefore DOMContentLoaded happens before the Load event.
addEventListener("DOMContentLoaded", (e) =>
  console.log("DCL", e.timeStamp + " ms")
);
addEventListener("load", (e) => console.log("Load", e.timeStamp + " ms"));
If we measure the DCL and load timings on an example page we get the following data:
DCL 657 ms
Load 1226 ms
How to view the DOMContentLoaded metric in Chrome DevTools?
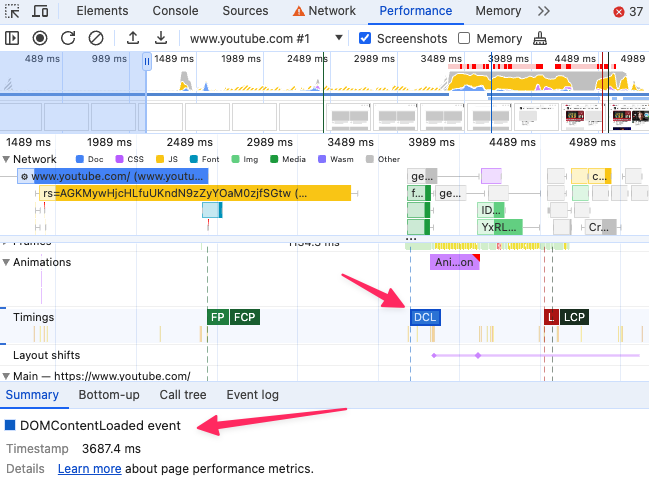
To measure DCL in Chrome DevTools you can collect a Performance recording. It then shows as part of the Timings lane. Click on the marker to see the exact timestamp.
How has the average DOMContentLoaded value changed over time?
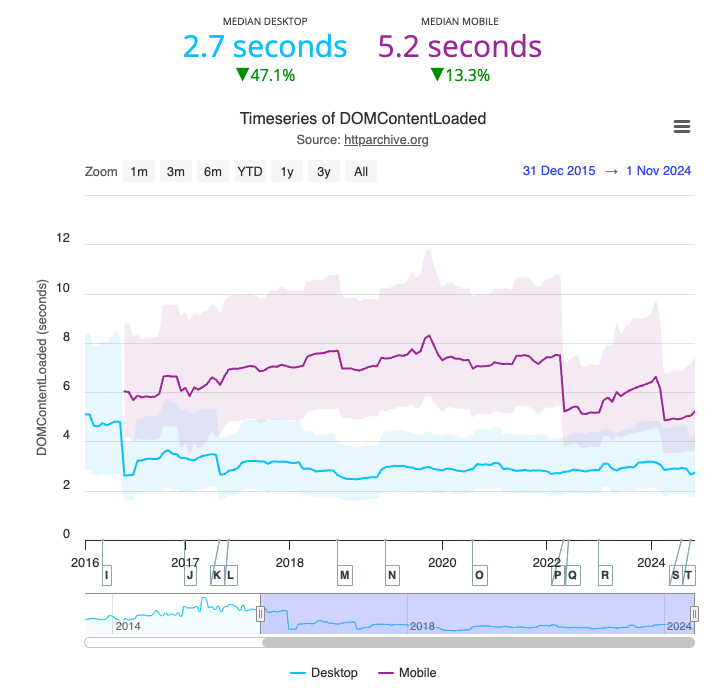
The HTTP Archive has collected DOMContentLoaded measurements since 2013. However there have been changes to the test environment over time, which makes it difficult to tell whether metric changes are caused by changes on the web or due to how the data is collected.
The test agent has used Chrome since 2016. At that time the typical DCL metric was 2.6 seconds on desktop devices. The most recent value from November 2017 was 2.7 seconds, suggesting that the metric has been stable.
HTTP Archive also tracks real user metrics from Google's Chrome User Experience Report (CrUX). Here Google reports whether the metric achieves a "Good" rating, meaning a DOMContentLoaded score below 4 seconds.
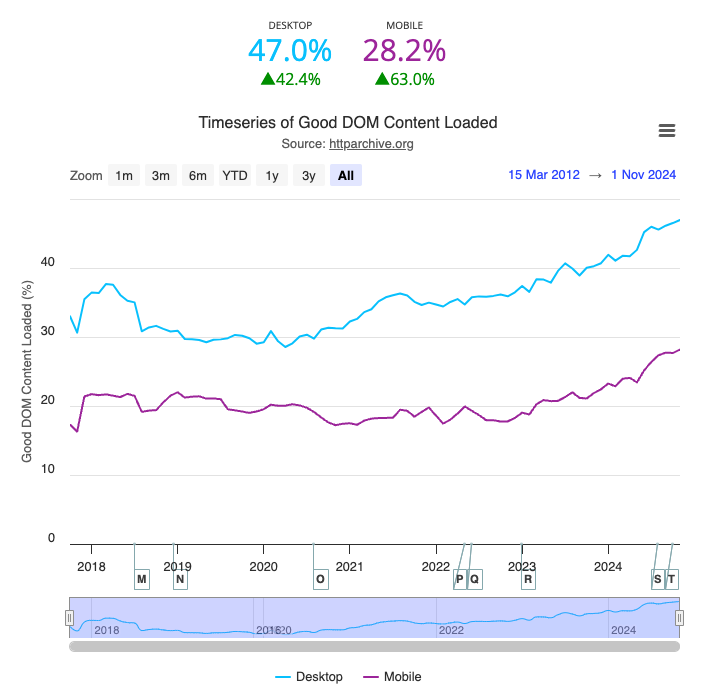
Here we can see that DOMContentLoaded has improved significantly since 2021. This might be because real users have faster networks and devices, while the HTTP Archive lab data is using a consistent test environment.
Is DCL a good metric to measure performance?
The main downside of DOMContentLoaded is that it does not tell you anything about the user experience. Unlike a page rendering milestone like Largest Contentful Paint, DCL fires regardless of whether the content that matters to the user is visible.
However, DCL does give you a good indication of how long it takes to load the initial set of page resources. It is also supported across all browsers, while Largest Contentful Paint only works in Chrome and Firefox.
Harry Roberts has a more detailed articles explaining use cases for DOMContentLoaded.
Use DOMContentLoaded to debug performance issues, but use a user-centric metric to assess your overall website performance.
How to monitor the DOMContentLoaded milestone
DebugBear can track DOMContentLoaded with continuous synthetic testing as well as real user analytics.
For lab-based testing you can open the Metrics tab in your test results to view a number of load time milestones including DCL and the Load event.

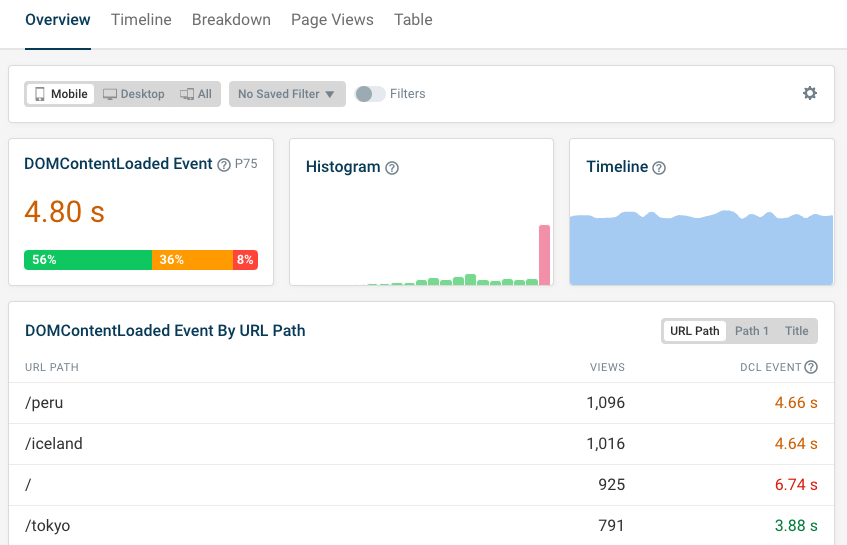
As part of our real user monitoring feature we also have a dashboard dedicated to the DOMContentLoaded metric. Here you can see the average DCL value, as well as a histogram indicating how DCL experiences are distributed across your visitors.
You can also see the top pages on your website and check where performance is slow.


Monitor Page Speed & Core Web Vitals
DebugBear monitoring includes:
- In-depth Page Speed Reports
- Automated Recommendations
- Real User Analytics Data