In this era of big data, effectively visualizing and interpreting data is crucial for making informed decisions and gaining actionable insights. Visualizing data through diagrams not only helps in interpreting complex datasets but also in communicating these insights effectively to a wider audience.

ChartDB is a powerful tool designed to simplify and enhance the process of visualizing complex databases. In this article, we’ll explore how to get started with ChartDB, practice creating your first database diagram, and provide you with practical tips to elevate your data storytelling skills.
What is ChartDB?
ChartDB is an open-source, web-based database diagramming editor that lets you visualize and manage database schemas through interactive diagrams.
While many tools in the ecosystem boast similar features, ChartDB stands out with its ease of use and features that make database visualization effortless. One such feature is instant schema visualization using a single query, Smart Query, which lets you import schemas directly as JSON files, thus making it incredibly fast to visualize your database. This can be useful for documentation, collaboration, or understanding database structures.
Other key features of ChartDB include:
- AI-powered SQL export — Generate database migration scripts for various platforms such as MySQL, PostgreSQL, and SQLite
- Interactive editing — Modify and annotate schemas directly in the tool
- Platform-agnostic — No installation or database credentials are required
ChartDB supports popular databases such as PostgreSQL, MySQL, SQL Server, MariaDB, and ClickHouse.
Getting started with ChartDB
Another standout feature of ChartDB is its flexibility in usage options. You can either use the hosted web app on the official website or self-host locally using Docker or Node.js.
The web app is the quickest way to get started with ChartDB. Simply sign in with a GitHub or Google account, and you’re ready to go. You can skip to the next section if you would prefer to use this method.
Self-hosting ChartDB
To install ChartDB locally, ensure Node is installed on your machine. Optionally, you can use Docker if preferred. Once these requirements are met, clone the repository with the following command:
git clone https://github.com/chartdb/chartdb.git
The repository is a few megabytes in size, so cloning might take a minute or two on slower networks. But once it’s completed, navigate to the chartDB folder and install the necessary dependencies:
cd chartDB
npm install
After the installation, start the development server with this command:
npm run dev
Once the server is running, open your browser and go to localhost:5173 to access ChartDB.
For production builds, use this command:
npm run build
ChartDB allows you to add AI capabilities to your locally deployed fork. To enable this feature, you’ll need a valid OpenAI key. If you have one, build the application with the following command instead:
VITE_OPENAI_API_KEY=<YOUR_OPEN_AI_KEY> npm run build
Note: replace <YOUR_OPEN_AI_KEY> with your actual OpenAI key.
Self-host with Docker (optional)
For those who prefer Docker, you can build and run ChartDB using the following commands:
docker build -t chartdb.
docker run -e OPENAI_API_KEY=YOUR_OPEN_AI_KEY -p 8080:80 chartdb
Again, replace <YOUR_OPEN_AI_KEY> with your OpenAI key. Once the build process is complete, access ChartDB by navigating to localhost:8080 in your browser.
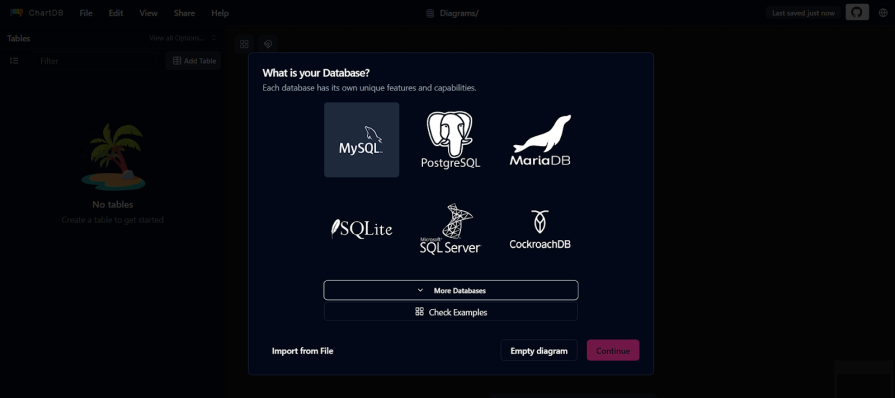
If everything is set up correctly, you’ll see the following screen when you start the local server:
In the next section, we’ll look at how to create your first database diagram.
Creating your first chart
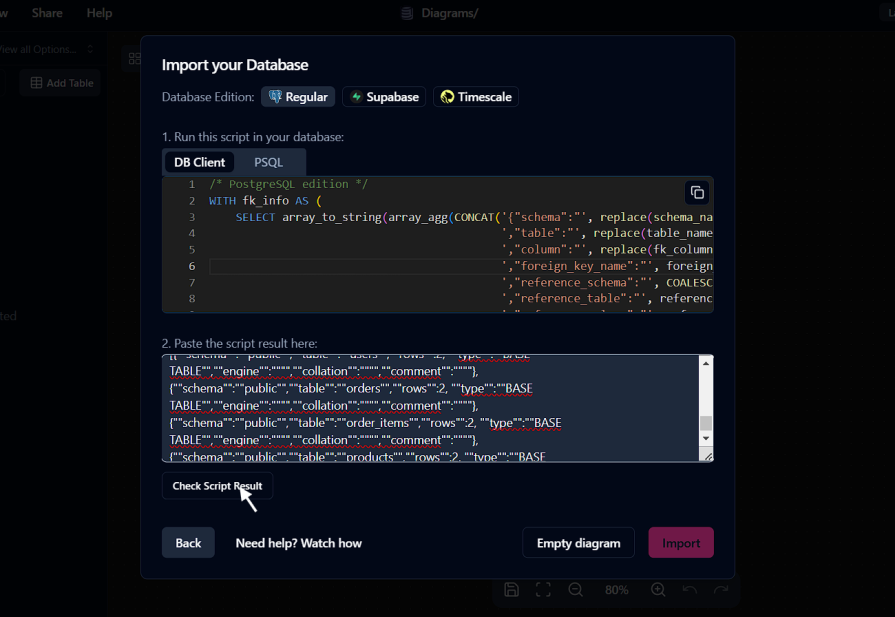
On your first visit to the ChartDB web app, you’ll get a modal prompting you to select your database type from a list of supported options, as shown in the image in the previous section. After clicking on a database icon, you’ll be taken to a screen similar to this:
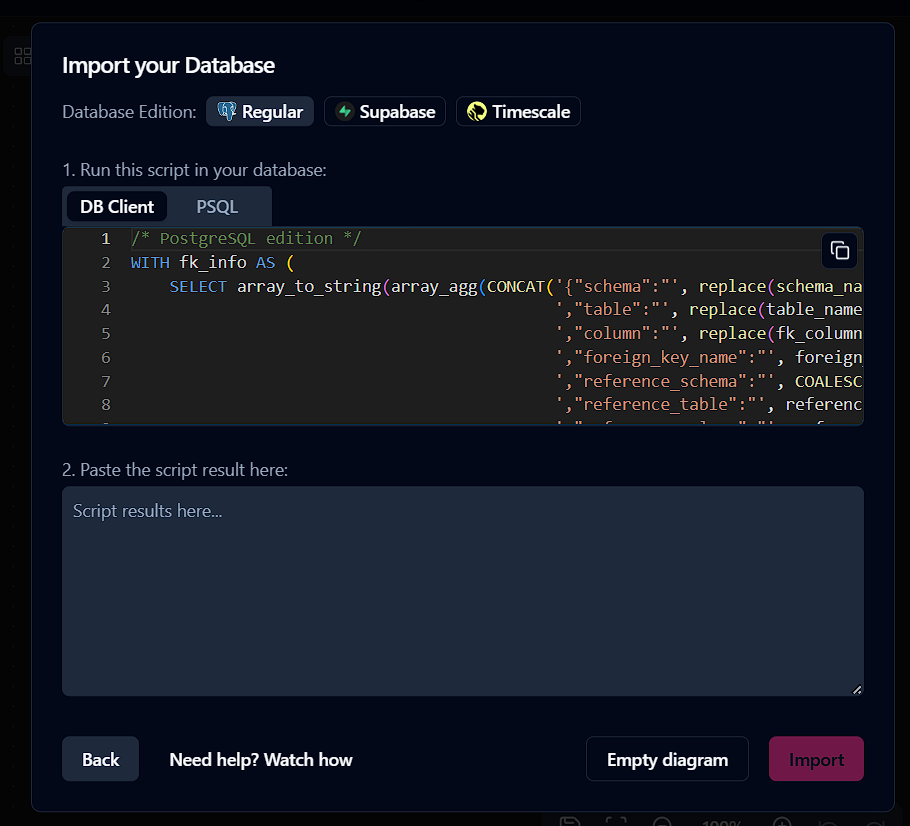
On this screen, you are provided with a “magic query“ script that you can run in your database to retrieve the schemas as JSON. Once you have the resulting JSON, you are expected to copy and paste it into the empty field. ChartDB will use this input to generate a visual representation of your database.
However, before copying the script, you must select your database edition. For this tutorial, we’ll use a PostgreSQL database, which offers three editions: Regular, Supabase, and Timescale. We’ll proceed with the Regular edition, but you should choose the one that matches your database type.
Next, decide how you want to run the script. You can use a database client interface like pgAdmin or the Postgres command-line tool. We’ll use pgAdmin for simplicity.
If you don’t have a Postgres database set up yet, you can quickly set one up by downloading and installing Postgres from the official website. It’s often quicker to just install the package, set up a database, and use pgAdmin to query the database.
However, PostgreSQL on Windows can sometimes be prone to errors. If you encounter issues with the standard installation process, consider setting up Postgres using Docker instead.
Once PostgreSQL is set up, connect it to pgAdmin using a hostname and port. Since PostgreSQL is running locally, the host will typically be your IP address and port, 5432.
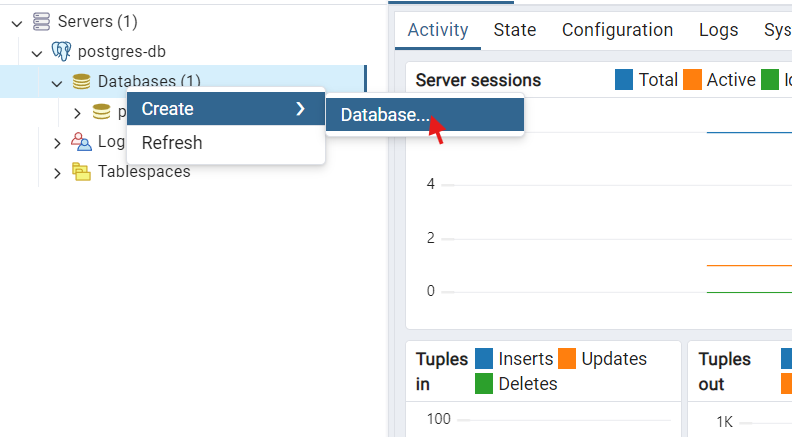
After successfully connecting to pgAdmin, right-click on the Databases menu, then select Create >Database from the context menu:
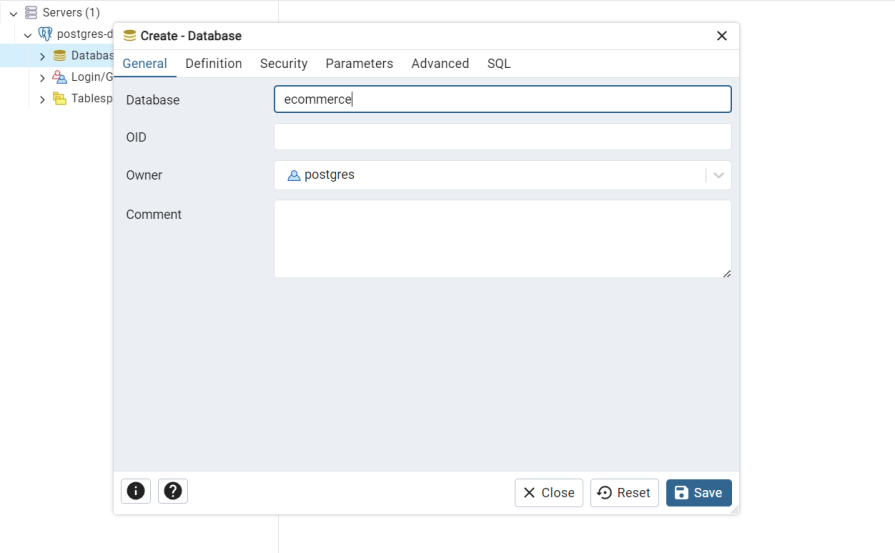
In the modal that appears, enter the database name in the Database field and click the Save button to create the database:
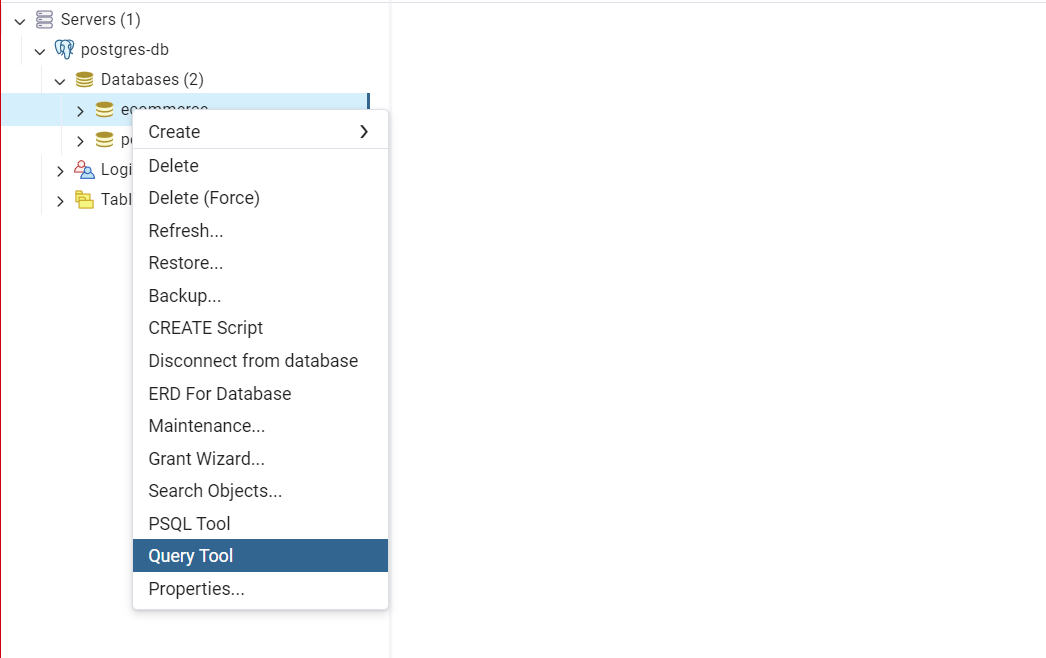
Once the database is created, it will appear in the Databases dropdown. Locate the newly created database (in this case, ecommerce), right-click on it, and select the Query Tool option from the context menu:
This will open a new tab with a Query field where you can input and run scripts using the Play icon or press F5 to query the database:
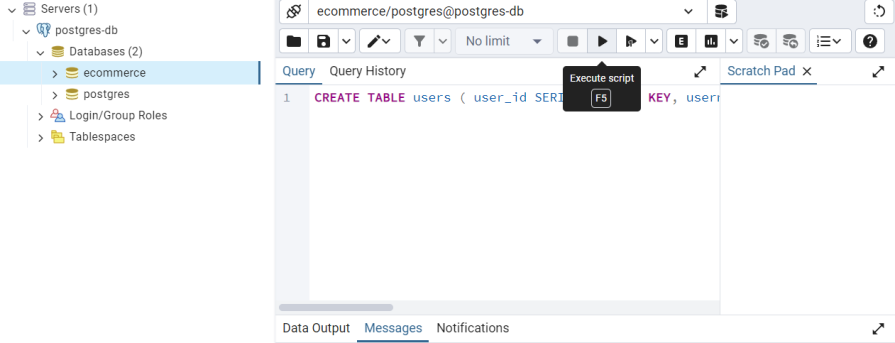
Follow these steps to add tables and sample data to your newly created database:
1. Create tables:
CREATE TABLE users (
userid SERIAL PRIMARY KEY,
username VARCHAR(50) NOT NULL UNIQUE,
email VARCHAR(100) NOT NULL UNIQUE,
passwordhash VARCHAR(255) NOT NULL,
createdat TIMESTAMP DEFAULT CURRENTTIMESTAMP
);CREATE TABLE products (
productid SERIAL PRIMARY KEY,
name VARCHAR(100) NOT NULL,
description TEXT,
price DECIMAL(10, 2) NOT NULL,
stockquantity INT DEFAULT 0,
createdat TIMESTAMP DEFAULT CURRENTTIMESTAMP
);CREATE TABLE orders (
orderid SERIAL PRIMARY KEY,
userid INT REFERENCES users(userid),
orderdate TIMESTAMP DEFAULT CURRENT_TIMESTAMP,
status VARCHAR(20) DEFAULT 'pending'
);CREATE TABLE orderitems (
orderitemid SERIAL PRIMARY KEY,
orderid INT REFERENCES orders(orderid),
productid INT REFERENCES products(product_id),
quantity INT NOT NULL,
price DECIMAL(10, 2) NOT NULL
);
2. Create indexes:
CREATE INDEX idxusersusername ON users(username);
CREATE INDEX idxproductsname ON products(name);
CREATE INDEX idxordersuserid ON orders(userid);
CREATE INDEX idxorderitemsorderid ON orderitems(orderid);
3. Add sample data:
INSERT INTO users (username, email, passwordhash) VALUES
('johndoe', 'john@example.com', 'hashedpassword1'),
('janesmith', 'jane@example.com', 'hashed_password2');INSERT INTO products (name, description, price, stock_quantity) VALUES
('Laptop', 'High-performance laptop', 1200.00, 10),
('Smartphone', 'Latest model smartphone', 800.00, 25);INSERT INTO orders (user_id, status) VALUES
(1, 'completed'),
(2, 'pending');INSERT INTO orderitems (orderid, product_id, quantity, price) VALUES
(1, 1, 1, 1200.00),
(2, 2, 2, 1600.00);
These scripts will create a database for a fictional e-commerce platform that will include a table for users, products, orders, and order items, along with some relationships between the tables.
After successfully creating the database and populating it with tables and data, clear the Query field, copy and paste the magic query from ChartDB, and then run it. If everything is set up correctly, the Data Output tab below the Query field will display a result similar to the example shown below:
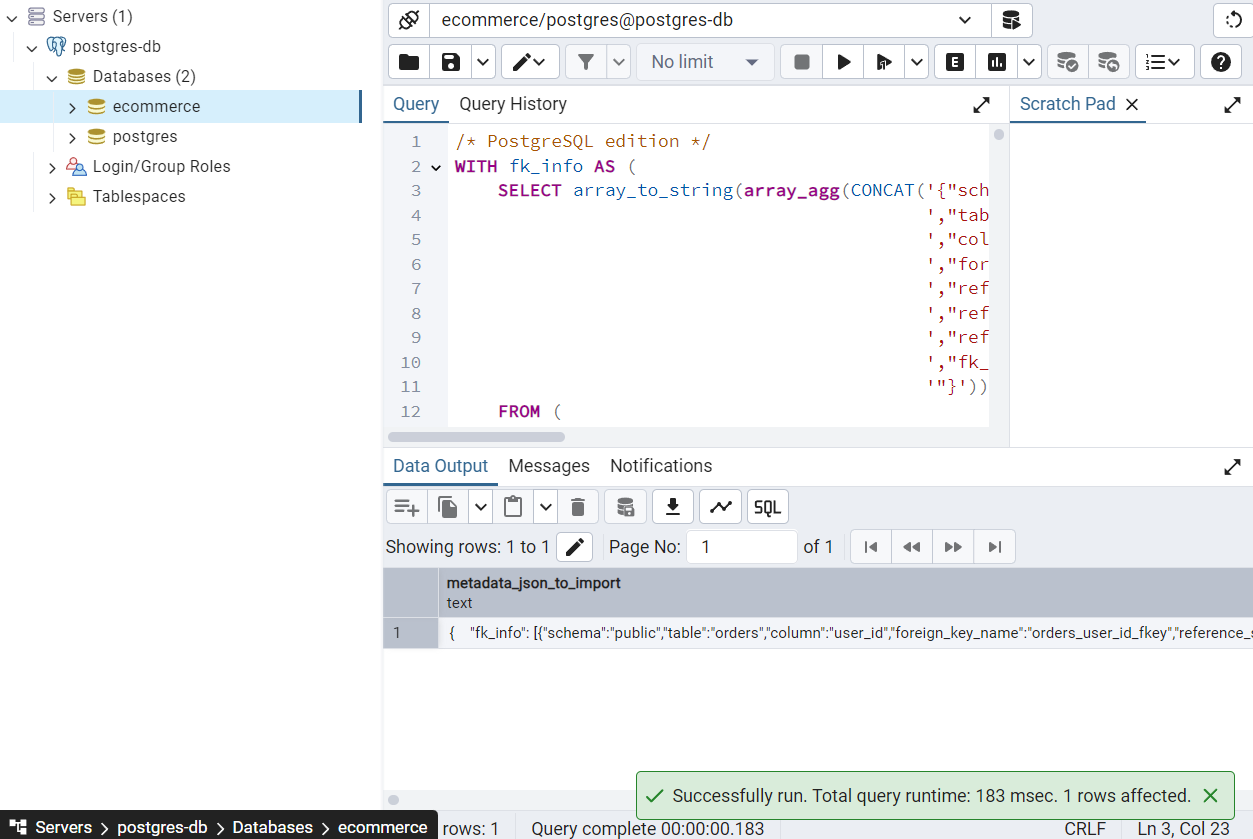
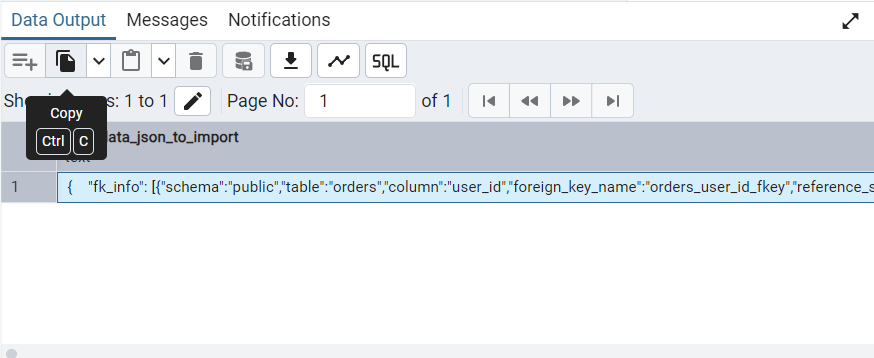
Here’s the schema for the database we just created in JSON format. To copy it, click on the JSON output to highlight the copy icon, then click the icon to copy the output to your clipboard:
Next, return to the ChartDB web app, paste the JSON output into the empty field in the ChartDB modal, and click the Check Script Result button to validate the script’s output:
Once the JSON schema is validated, click Import, and ChartDB will generate a diagram from it:
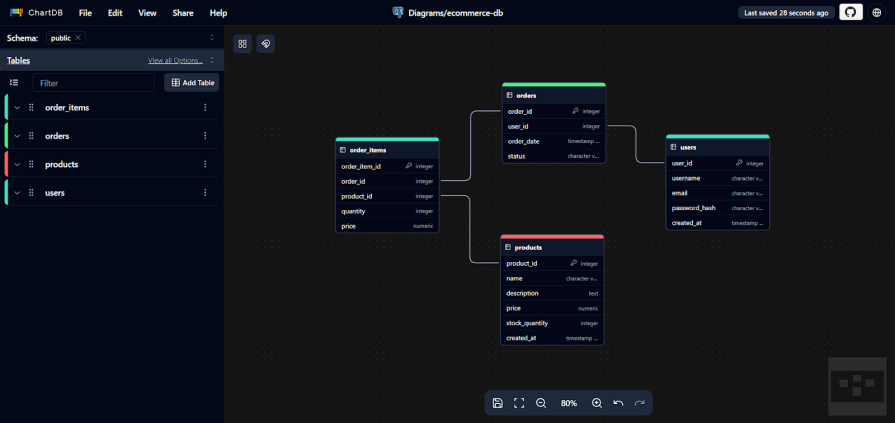
Congratulations! You’ve successfully created your first diagram in ChartDB. Next, we’ll explore the editor and examine how its components work together.
Exploring the editor
Now that you have a database visualized, let’s look at how to use the editor to enhance your visualization and explore the additional features ChartDB offers.
At a glance, the editor is divided into two intuitive sections:
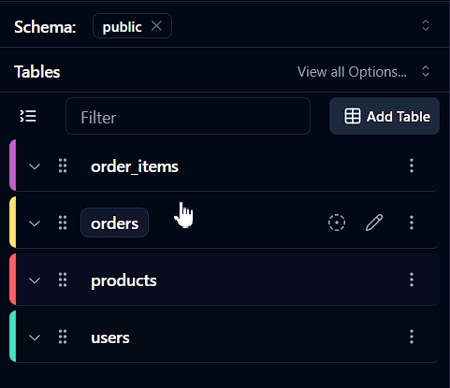
Left panel (schema explorer)
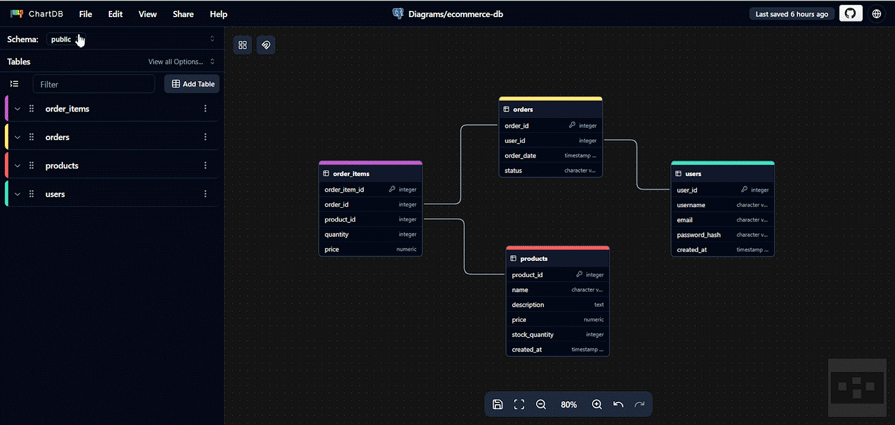
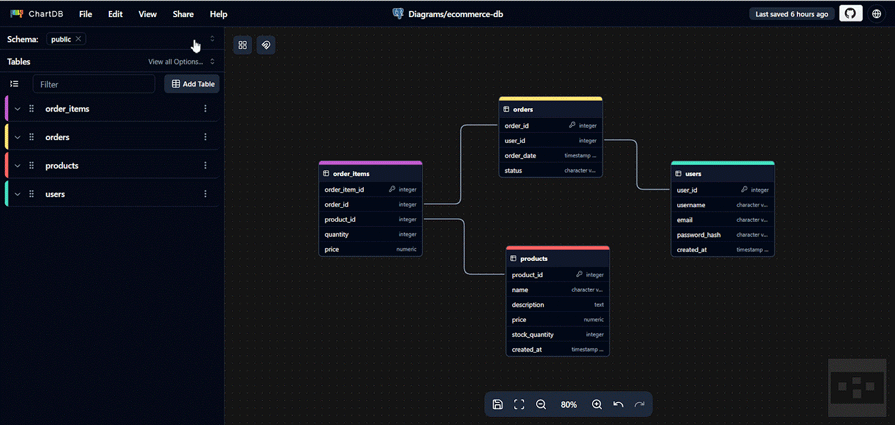
This section contains a list of all the tables available in your database schema. You can add new tables, modify existing ones, and establish or edit relationships between tables directly in the editor:
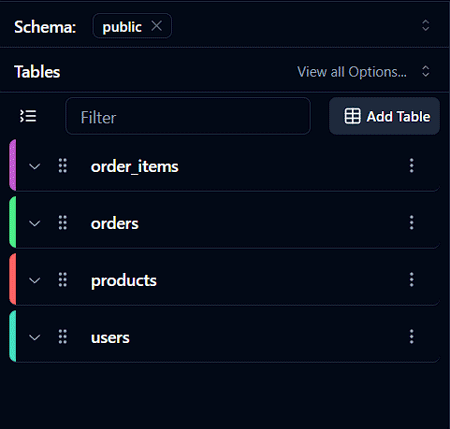
The tables are displayed in an expandable tree view which allows you to drill down into each table to view, edit, or add columns and indexes. You can also add annotations, which is particularly useful for collaboration and documentation purposes:
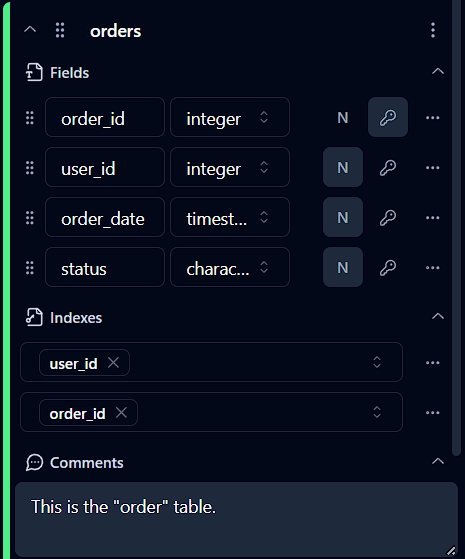
The search bar at the top of the panel dynamically filters through the list of tables to find specific tables or columns quickly:
Right panel (main workspace)
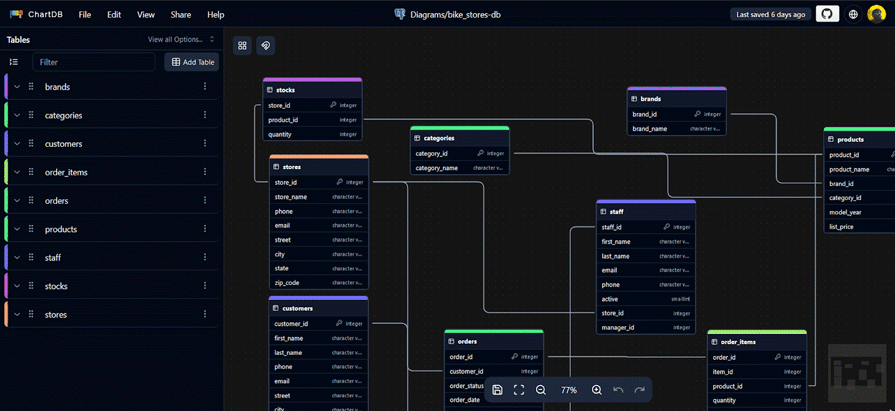
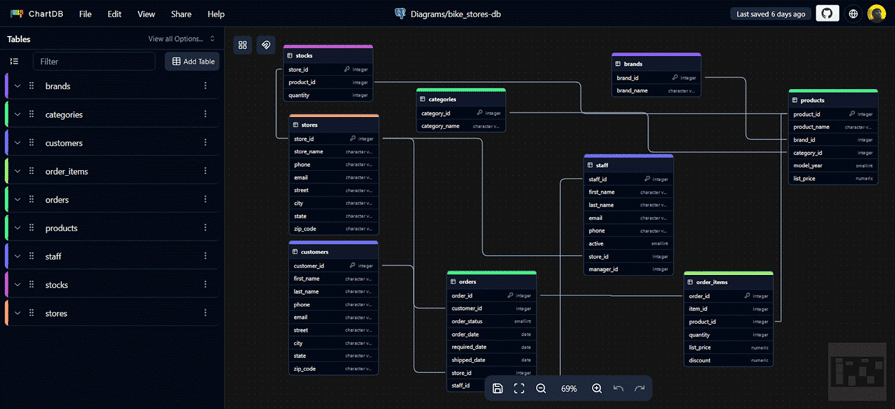
This is where the magic happens. The main workspace is a grid board that displays your database tables as movable boxes, with columns and keys clearly listed inside each box:
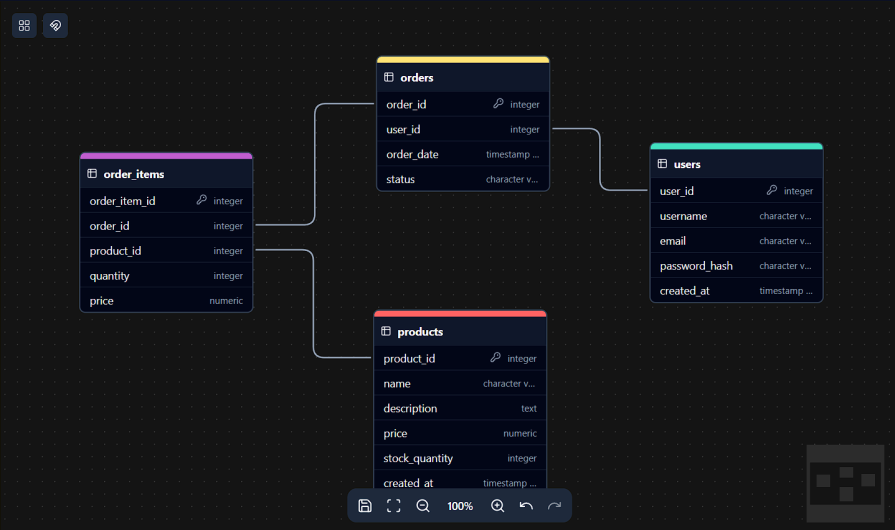
Lines connecting the boxes represent relationships (foreign keys) between tables. They illustrate how the boxes interact and provide a clear visual of table relationships:
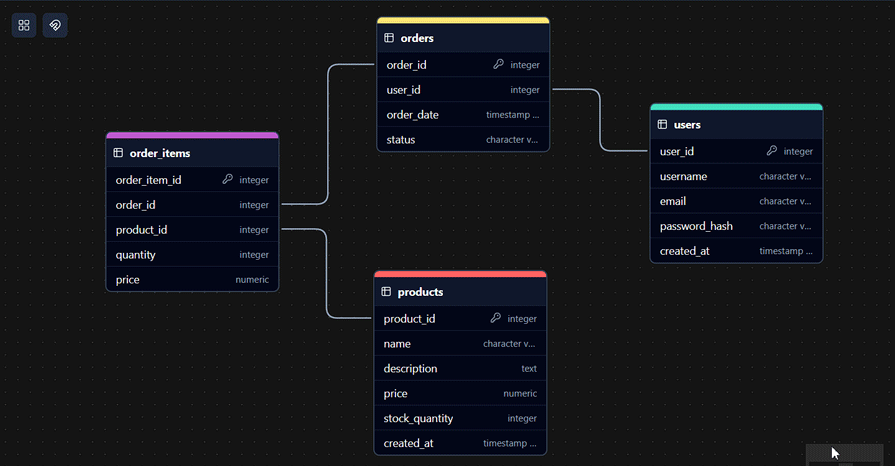
The boxes support interactive editing, meaning you can click the edit icon to expand the table’s tree view in the left panel, where you can add new properties or modify existing ones.
Relationships can also be established directly on the board using connection points (or anchors) that appear when a box is clicked:
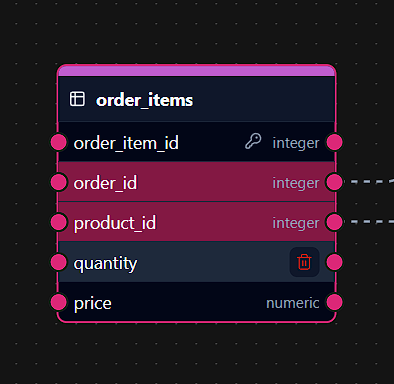
These connection points indicate where relationships can be created or already exist on the boxes. You can drag a connection point to another table’s connection point to establish a foreign key relationship. However, it’s important to note that connections must be made only between related fields.
In the example below, an error occurs when we attempt to connect two unrelated fields, but succeeds when we turn them into related fields:
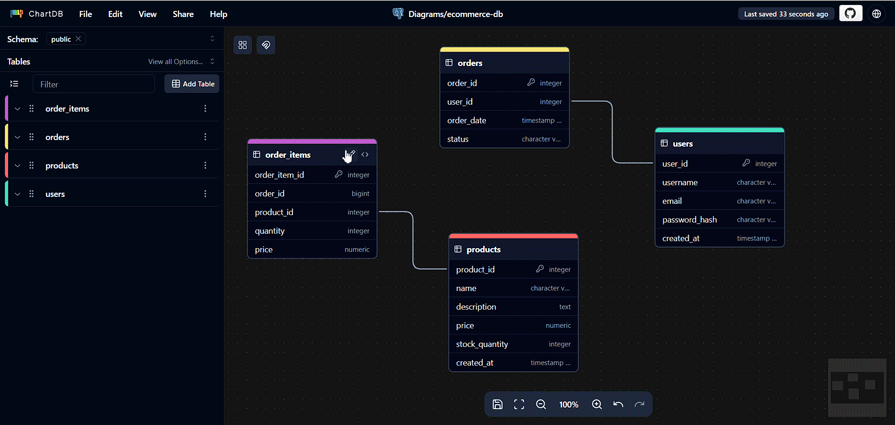
At the bottom of the board are the board controls. These controls allow you to zoom in and out of the schema view and pan around the workspace to focus on different parts of the database structure.
AI-powered SQL export
ChartDB’s AI-powered SQL export simplifies database migration across different systems. It automatically generates Data Definition Language (DDL) scripts tailored to specific database platforms. That is, the AI adjusts data types, constraints, and other schema elements to match the conventions and requirements of the target database.
For instance, it can convert AUTO_INCREMENT in MySQL to SERIAL in PostgreSQL or handle differences in primary key and index definitions.
To use this feature, click the File menu option on the editor’s navbar, select the target database from the Export SQL list, and generate a customizable DDL output:
In this example, we successfully migrated a PostgreSQL database to MariaDB without requiring deep expertise in both systems. This way, we can minimize errors and save time by eliminating the need for manual rewriting.
Note that to use these features locally, you must set an environment variable with an OpenAI key when building the application. Without this key, the AI SQL export feature will not function.
If you don’t have an OpenAI key but want to access these features, consider using the web app, where the AI features work out of the box.
Embedding and sharing diagrams
ChartDB makes sharing diagrams and embedding database schemas a breeze. You can save diagrams as image files (e.g., PNG or SVG) for slideshows or email attachments. Additionally, you can export them as JSON files for embedding diagrams into external web pages or sharing real-time ChartDB workflows with teams or clients.
To share a diagram, click on the File menu in the navbar. Below the Export SQL option in the dropdown menu, you’ll find the Export as option. Click it and select your preferred image file type to export the diagram:
To export a diagram as JSON, use the Share menu in the navbar and select Export Diagram:
You’ll also notice the Import Diagram option below the Export option. This allows you to import shared diagrams in JSON format from another ChartDB user or a validated JSON file compatible with ChartDB:
Conclusion
ChartDB is relatively new to the database diagramming ecosystem and may not yet be on par with tools like DBeaver and dbdiagram in feature depth and community scale. However, ChartDB offers a refreshing approach, with its straightforward database visualization and intuitive user interface.
Whether you’re a data analyst, business professional, or developer, mastering ChartDB can help you transform raw data into clear and meaningful visuals.
The post Mastering charts and database visualization with ChartDB appeared first on LogRocket Blog.