At Mux, building video at scale comes with many interesting challenges. We’ve built systems that stream millions of minutes every hour, but the fun doesn’t stop there. Every second of video that gets uploaded, watched, or deleted must be pulled from sources like CDN logs and tracked in a way that can be used by customer dashboards, billing & analytics, and our Delivery Usage API. That’s… a lot of data.
For a long time, we had relied on our trusty old usage pipeline to accomplish this. But as Mux scaled, the existing system became limiting in terms of product and performance. To support new features (e.g. high usage alerting), we needed to achieve fresher data, higher throughput, and faster queries in our pipeline.
In this post, we will cover:
- The limitations of our existing pipeline
- The changes we made to improve performance and scale
- Reflections and future plans
How our architecture looked in the past
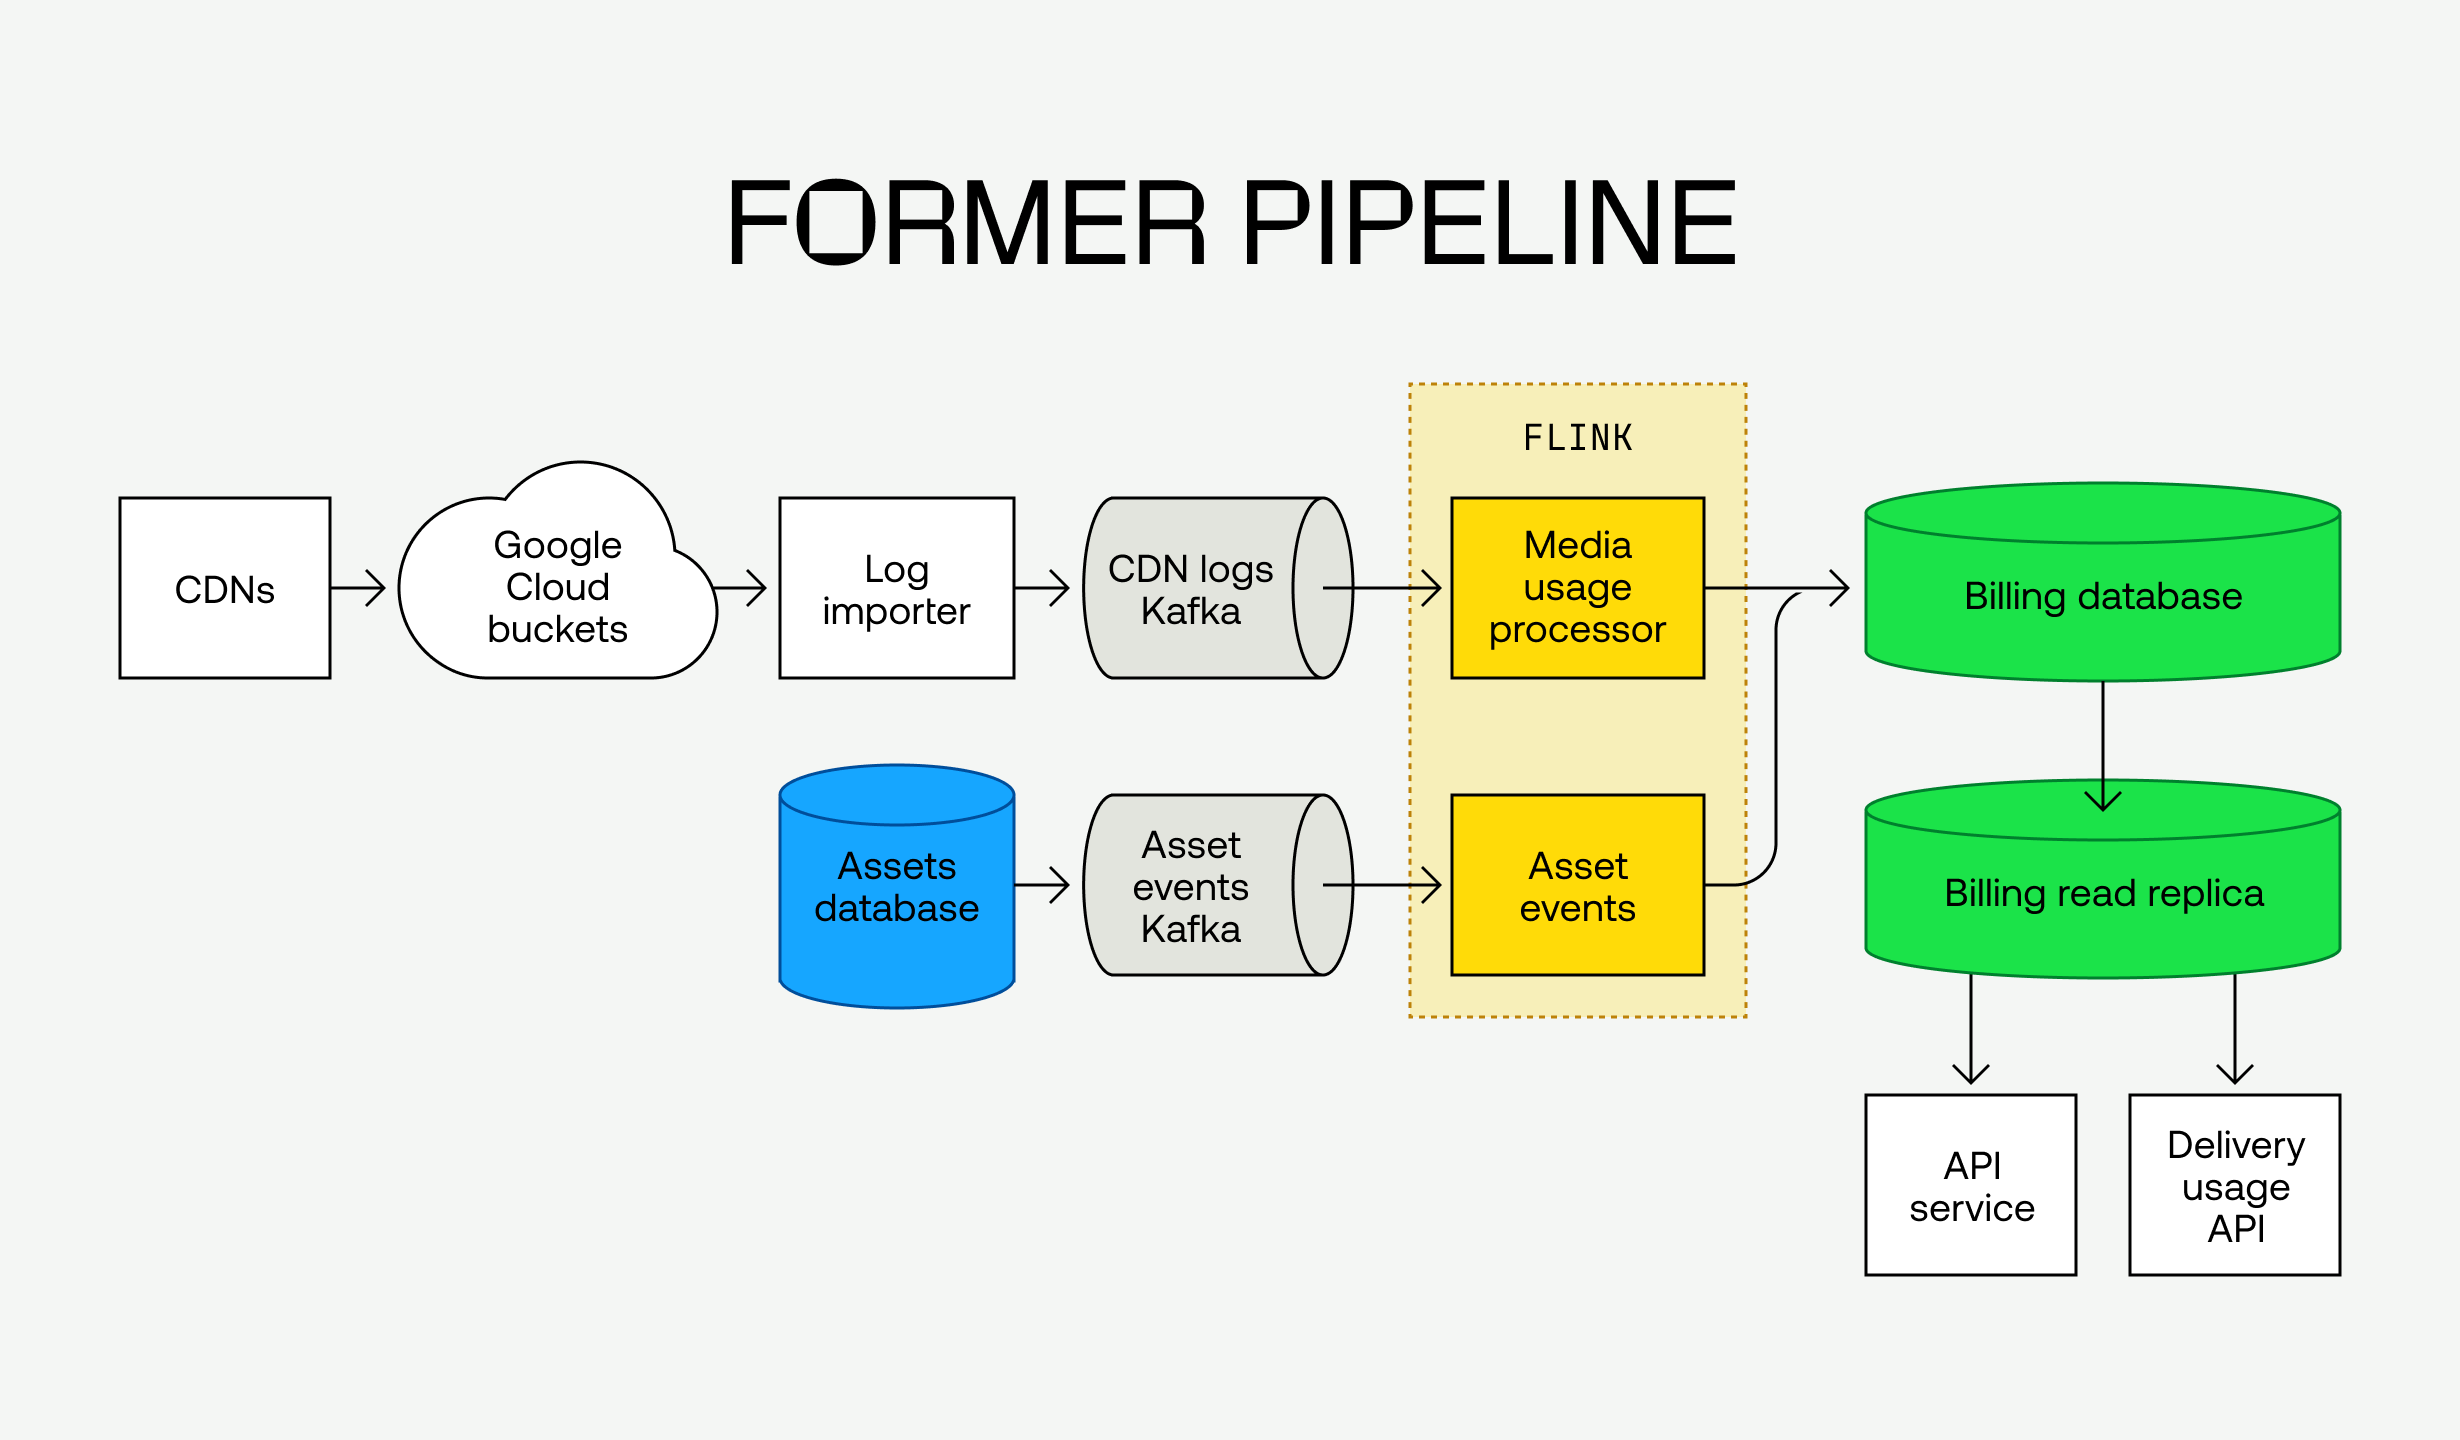
Here is a representation of the former pipeline:

CDN log processing
When a view occurs, the activity is logged within one of our CDNs. Log Importer pulls CDN logs from cloud bucket stores, performing exactly-once processing and enrichment. Enriched log messages are sent to Kafka where they are further processed and aggregated by the Media Usage Processor (MUP) Flink application. Aggregate rows are written to Postgres, which serves read queries by downstream consumers.
Internal event stream processing
In various regions, internal CDC events are queued, transformed and then mirrored into a single-region Kafka cluster. Asset Events Flink further transforms and enriches the events, then updates Postgres with the finalized results.
How we were using Flink
Apache Flink is a popular stream processing engine which can perform stateful computations with exactly-once guarantees. Common use cases include anomaly detection and real-time analytics. Our MUP Flink application made use of Window functions in order to collect various aggregates like “seconds delivered” for a given video.
For a given entity (e.g. video asset or environment) it would keep track of hourly aggregates, then finalize and write them to Postgres. Before finalizing any row, it had to delay a certain amount of time (determined by maxOutOfOrderness, affectionately dubbed “MOO” 🐮) to be reasonably sure no late records would arrive. Since we had no guarantees about ordering of CDN log records, the MOO value had to be at least an hour in order to ensure we finalized hourly windows only after all records had been processed.
Asset Events Flink was simpler - its main function was to perform stateless transformations on incoming events before writing them to Postgres. Maintaining a distributed Flink deployment for this felt like overkill.
Challenges with our Flink architecture
The old system served us well for a long time, but our needs changed as we expanded our user-base and feature set.
- During popular live events, like the US presidential election, traffic surges could cause MUP Flink to become a throughput bottleneck unless scaled. With careful tuning and verification this could be fully automated, but at the moment scaling still involved some manual intervention.
- While our user base continued to grow, we were also adding new features and breakdowns to our billing dashboard. Increasing user traffic and aggregate complexity led to very slow queries (>1s).
- Operational challenges: Our Flink deployments were managed using the Flink Kubernetes Operator and implemented with a different language (Java) than the rest of our stack (Go). Coupled with Flink’s steep learning curve, this meant we had a tough time debugging or deploying changes with high confidence. The technology being an outlier from our usual stack meant there was little support in terms of tooling, which made ops tedious.
- The performance issues with our self-hosted Postgres repeatedly required delicate sharding and vertical scaling mitigations.
New features were also blocked:
- Alerts: The ability to alert on high usage was a popular feature request among customers. However, our current aggregates would be stale by multiple hours by the time they were available for any alerting.
- Better visualization and analytics: We also wanted to enhance our billing dashboards with more detail and dimensions. But the required additional load on our Postgres was a complete no-go at this point.
Time to rethink our approach
As growing pains and blocked features grew more pressing, we decided it was time for a rearchitecture. We needed to overcome these key issues:
- Poor aggregate query performance
- Poor data freshness
- Operational challenges
And, whatever solution we came up with needed to meet the following functional requirements:
- Can power high usage alerting
- Can provide detailed usage breakdowns with hourly granularity for the past 90 days
- Continue to support billing & invoicing jobs
Laying out the options
After careful research and discussion, we agreed that we had three options:
Option 1a: Have ClickHouse serve read queries
We could keep our existing setup, but swap in ClickHouse, a database optimized for fast analytics queries, as the read-only replica for Postgres. This would require the least work, but only addressed our poor aggregate query performance, and would exacerbate operational challenges.
Option 1b: Have Flink write to ClickHouse
Instead of keeping both Postgres and ClickHouse, we could replace Postgres with ClickHouse entirely. This would be pretty similar to the previous option, but without impacting data freshness issues or ops.
Option 2: Change the way we were using Flink, invest in operability, vertically scale Postgres
To improve data freshness, we could rewrite our MUP Flink application to publish more frequent but incomplete aggregates for a given hourly window, and add functionality to update those aggregates for late events.
This second approach would be complex in terms of handling late event edge cases, as well as maintaining intermediate hourly state. We’d also need to be careful not to shorten the write intervals too much to keep the number of DB writes reasonable. Whatever interval we selected would become the floor in terms of data freshness.
In addition, we’d have to perform vertical scaling of Postgres to better handle reads and increased writes. But there was no getting around the fact that an OLAP database like ClickHouse was more suitable for querying aggregates across many dimensions.
Flink is a powerful but complex technology with a steep learning curve. Some organizations dedicate entire teams to operating Flink clusters. While we could cultivate team expertise, none of us were excited about working with Java. In all honesty, this really biased us against this option.
Pros
- Would reduce data staleness
- Might improve read query performance
- Stream processing component can remain horizontally scalable
Cons
- Operability burden
- Data freshness still not ideal for our use cases
- Aggregate queries are unlikely to be improved to the level we require
- Working with Java…
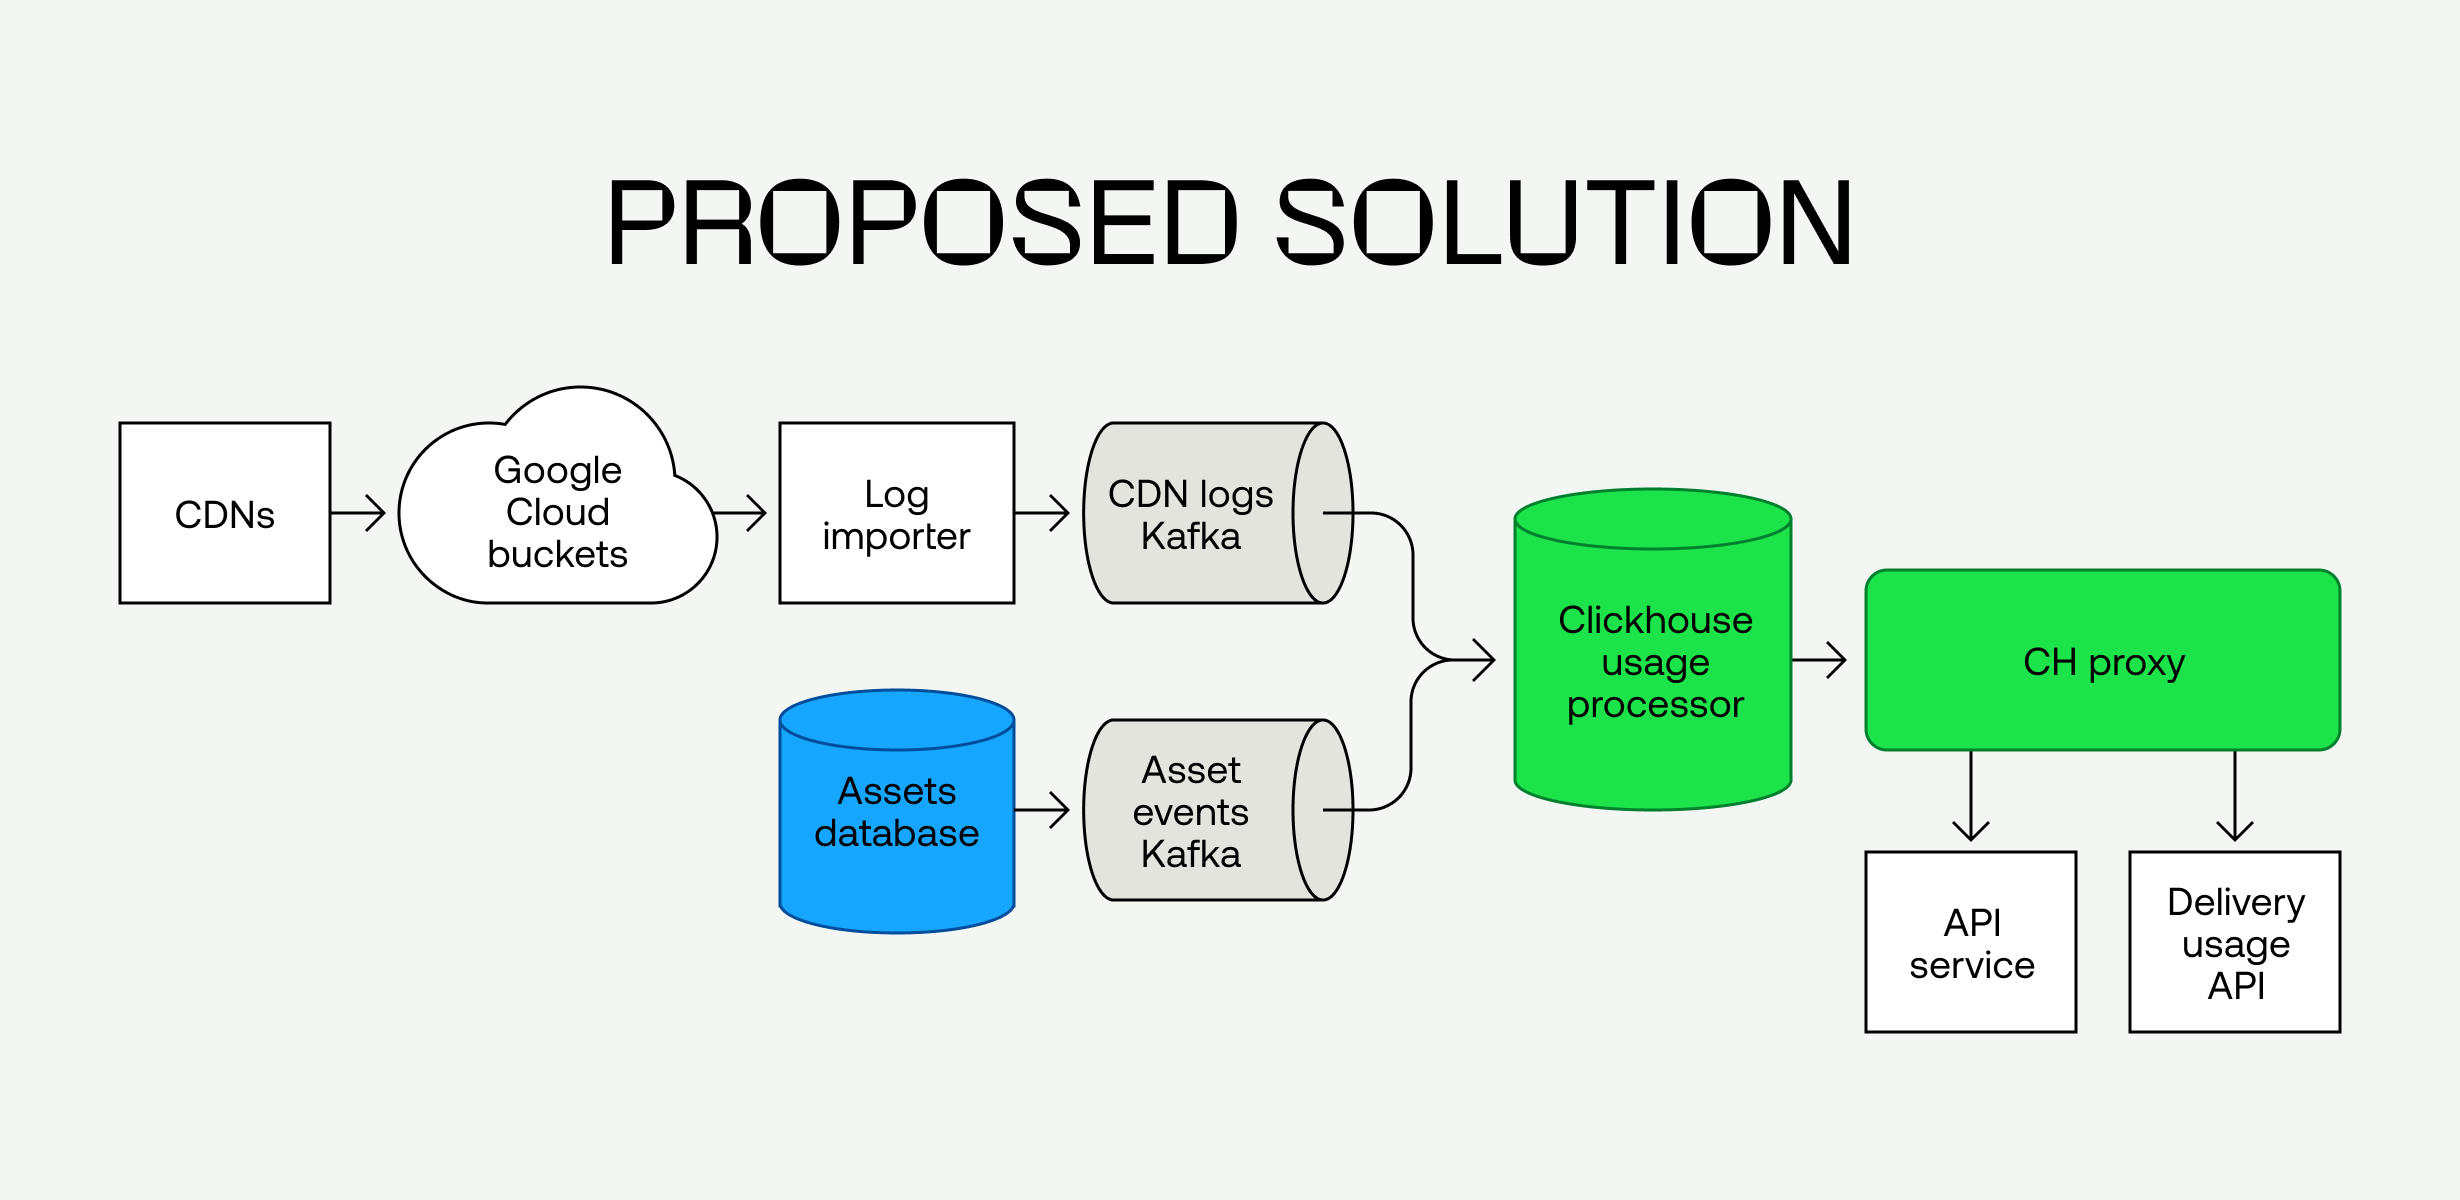
Option 3: Use ClickHouse as our stream-processing engine and persistent data store, replacing both Postgres and Flink

While we don’t have a team of Flink experts, we do have a team of ClickHouse experts. ClickHouse is an OLAP column-oriented database that uses a SQL-like query language. It is useful for “complex calculations over massive datasets”, like real-time analytics over huge data streams. Our Data team has long used ClickHouse to power the Mux Data product, which monitors some of the world’s largest livestream events in real time.
This organizational expertise allowed for a design that leaned very heavily on ClickHouse. Not only would we use it as a database to serve real time aggregates, we would also use it as a stream-processing engine that could replace our Flink applications. To achieve this, we would need to translate all of the Flink/Java application logic to SQL. Fun!
This was an ambitious approach that leaned much more on its data store than most traditional methods. However, past experience gave us high confidence that such application of the database would be possible.
Pros:
- Improved read queries
- Maximized data freshness
- Operational burden - This was a small net pro. On one hand, we’d have to maintain a new ClickHouse cluster. On the other hand, we could stop maintaining Flink and Billing Postgres. We had better tooling and support for ClickHouse, we still felt better about operating the new cluster.
Cons:
- Not horizontally scalable
- Increased business logic in SQL - this would make development, iteration, and mitigation harder. We accepted this as a tradeoff in the initial implementation with the intention to evolve the schema to decouple the logic in a later phase.
- Limited expression - conversion from Java to SQL put a ceiling on logical complexity, so we would be more limited when defining future behavior in this layer
Implementation phase
ClickHouse is generally used for simple computations, like arithmetic or aggregation, over large data streams. However, the Flink logic we were trying to replicate was more complex than the usual SQL operations. For example, on an incoming record we had to classify its type, determine if and how much we should bill on, and extract nested objects for processing.
Explaining how we achieved all of this stream processing logic in our schema would be difficult without a good understanding of ClickHouse, so we'll save the gory details for a future post. The basic gist is this: we used Kafka Table Engines to ingest from Kafka, then sent the data through a series of cascading Materialized Views and Null Tables, which allowed us to pre-aggregate and transform the data several times before dumping it into rollup tables, which were optimized for aggregate queries.
Additional considerations
In some high volume pipelines, performance can be prioritized over accuracy. The critical nature of our data prevented us from making this tradeoff. We needed to guarantee exactly-once processing, because overbilling would be unacceptable. It also might not be enough to guarantee at-most-once processing, because missing an Asset Deleted event would mean we would keep charging a customer for storing an asset when they had already deleted it.
Our real time aggregates also had to remain accurate and performant with query windows which varied from a few minutes (to power usage alerts) to over 30 days (to support billing dashboards and invoicing).
In a future post, we’ll do a deep dive into how we leveraged the features and limitations of ClickHouse to achieve these things.
Testing and release
With this bold new design and the already sensitive nature of usage data in mind, ensuring the integrity of the system was a top priority as we built it up and rolled it out. Even small amounts of lost data or changes to usage categorization will add up to substantial billing inaccuracies at our scale, and we needed to prove that the new system would be just as reliable as the old.
We started by copying over all of the existing data in Postgres to ClickHouse and feeding in new data via Kafka, which was made easier thanks to ClickHouse’s Postgres table engine and our aggregating schema design, but we still needed to verify that there were no dropped or duplicated usage events.
Working closely with our Analytics team, we did extensive comparisons in our data warehouse between the Postgres and ClickHouse datasets. Then, going a step further to validate the data we would return to our customers via the Usage API or invoices, we also set up a query shadowing system, where any read query run against the Postgres database would be followed by sending the equivalent query to ClickHouse. The query results would then be compared, and the difference would be logged for us to monitor the frequency of mismatches.
Together, these approaches gave us two different views on data integrity and allowed us to safely identify and fix a number of issues during testing. One issue was a rare race condition between the CDN Logs and Internal events. In our schema, we use materialized views to combine data from both event streams, but we hadn’t properly accounted for the order that events arrive in sometimes being different, resulting in some usage being miscategorized.
Another issue that we detected was that accounts with a large number of assets had discrepancies in their usage, while smaller accounts were unaffected. This turned out to be a rounding error in how we calculated an asset’s storage duration, which was insignificant for individual or small numbers of assets, but added up when aggregated across many assets. Because both of these issues only occurred at scale, we would have missed these without our integrity checks. Instead, we caught them quickly and were able to fix them well ahead of release, by which time there was little room left for doubt.
When it finally came time to switch over to the new usage pipeline, the query shadowing system again made this easy and safe. Simply flipping a configuration made clients of the usage databases return the results from ClickHouse instead of Postgres, while still logging the diffs for post-release monitoring. We kept the old system running so that we could cut over back to Postgres just as easily in case an issue arose. Thanks to our careful approach to validation beforehand, however, we never had to, and the old usage pipeline was decommissioned a month later. We’ll miss you.
Ensuring data integrity is an important part of any data migration, even more so when working with business-critical data. This two-pronged approach of verifying data at the source of truth and at the system’s boundary can save a lot of time by catching issues upfront and make rolling out smoother, and should be an essential part of any such project.
Results and performance
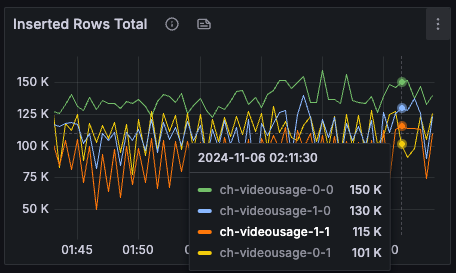
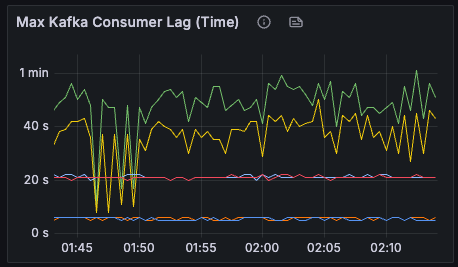
With our cluster scaled to 60 vCPUs x 4 nodes, we can sustain throughput of almost 500k writes/s while keeping consumer lag under a minute. Below is a look at our charts during the night of the presidential election, during which we saw a surge in viewers tuning in to live coverage:


To avoid over provisioning hardware, we have sized our ClickHouse cluster to comfortably handle daily traffic, with some headroom to handle bursts during popular events. When we get to a point where we need to increase throughput, scaling our cluster is relatively easy. We can provision machines with higher CPU, scale up our Kafka Table Engine parallelism settings, and roll our ClickHouse nodes one at a time without compromising availability.
Would we do it again?
Using a database as both a stream processor and data persistence layer comes with unique advantages and disadvantages. Completely eliminating the intermediate hourly window aggregation step allowed us to improve data freshness from several hours to a few minutes at worst, while preserving 100% accuracy. By removing Flink, we did away with an entire class of problems around data synchronization between the processor and database, enormously simplifying state management.
We also benefited a lot from the Data team’s experience operating ClickHouse at scale, which gave us an in-depth understanding of its more advanced features and limitations. The cluster is able to handle a huge amount of writes per second, with room to grow.
There are definitely tradeoffs to this approach as well. Automatic scaling is not built-in unless you’re using ClickHouse Cloud, and will be a more heavy-weight operation than some latency-sensitive or bursty workloads can tolerate. Creating a ClickHouse schema that is both expressive and performant enough for complex stream processing at high volumes requires deep expertise and an organizational commitment to maintaining it. Capturing business logic in SQL is never something to be done lightly, as it can make development, testing, deployment, and debugging more difficult. We did so to make the initial transition easier, but had a plan for future improvements.
As of the writing of this post, we have started to move the more specific business cases (which can frequently change) into upstream and downstream services. The goal is to evolve our ClickHouse schema into a generic stream processing engine that performantly aggregates along dimension sets without being aware of their business context.
With sufficient investment in operability and performance tuning, we’ve been impressed with ClickHouse's ability to perform near real-time stream processing at scale, all while serving immediately consistent aggregates on the data set. We would recommend ClickHouse for processing that fits most of these requirements:
- Must efficiently support complex, 100% accurate computations
- Using an alternate windowed aggregate approach, where results are unavailable until their time window closes, is limiting
- Queried time frames vary widely and can range from the past hour to the past month
- Frequent scaling with highly variable workloads is not needed
However, this approach definitely requires upfront investment in learning and operating ClickHouse. If an organization does not have or want to develop expertise in ClickHouse, we would not recommend this kind of design.
What this approach unlocks for our future
We’re pleased with how the new architecture has opened up a whole suite of new features that had not been feasible to build on top of the old system.
The improved aggregation and query performance allows us to access the data more often and in new ways, enabling us to provide more granular billing representations to internal teams and our customers. Internal teams will soon gain the ability to recognize revenue with much greater fidelity than before, saving hours of work each month, and customers will be able to dive deeper into their spend through new dashboard visualizations and APIs.
On top of that, the increased freshness of the data will no doubt benefit these features, and it also unblocks billing alerting, addressing a frequently requested feature and helping customers to monitor and control their usage without having to watch or track it themselves. And with the simpler architecture, we can build and operate all these new features with confidence, delivering the accuracy and uptime our users expect from Mux.