What are viewers watching? How long are they sticking around? What are top-performing videos? What’s trending right now?
These are key questions that help you understand the success of building video in your product. Whether you’re creating video or working with creators, gaining insights into how viewers are engaging with your content makes a difference. It can affect your content roadmap or your product roadmap. It can help you identify audience trends and capitalize on the best-performing content. It can even help you understand how investing in video is propelling your product forward.
That’s why we’re excited to announce a brand new way we’re helping you answer these questions: Mux Engagement. Mux Engagement provides you with a comprehensive overview of top-line metrics and trends, detailed reporting about top and trending content, and deeper insights into how viewers are engaging with specific content.
35 days 100 days of data
Trends in engagement take time to emerge. Sometimes content can spike quickly in popularity, but have less engagement over time. Or you can have that slow-and-steady content that looks low week to week, but in the aggregate is making a real impact.
As a part of this release, we’re extending the data retention period for all Mux Video users and Mux Data Startup and Pro plans from 35 days to 100 days.
If you’re on a contract plan and have questions about how this may affect you, reach out to your account team.
Mux Data Startup is included for free for all Mux Video users. Mux Player comes with Mux Data built in. Not using Mux Player? Learn more about how you can enable Mux Data and start tracking engagement and quality of experience metrics for your videos today.
Understanding top-line metrics and trends
Let’s dive in and walk through our new engagement module.

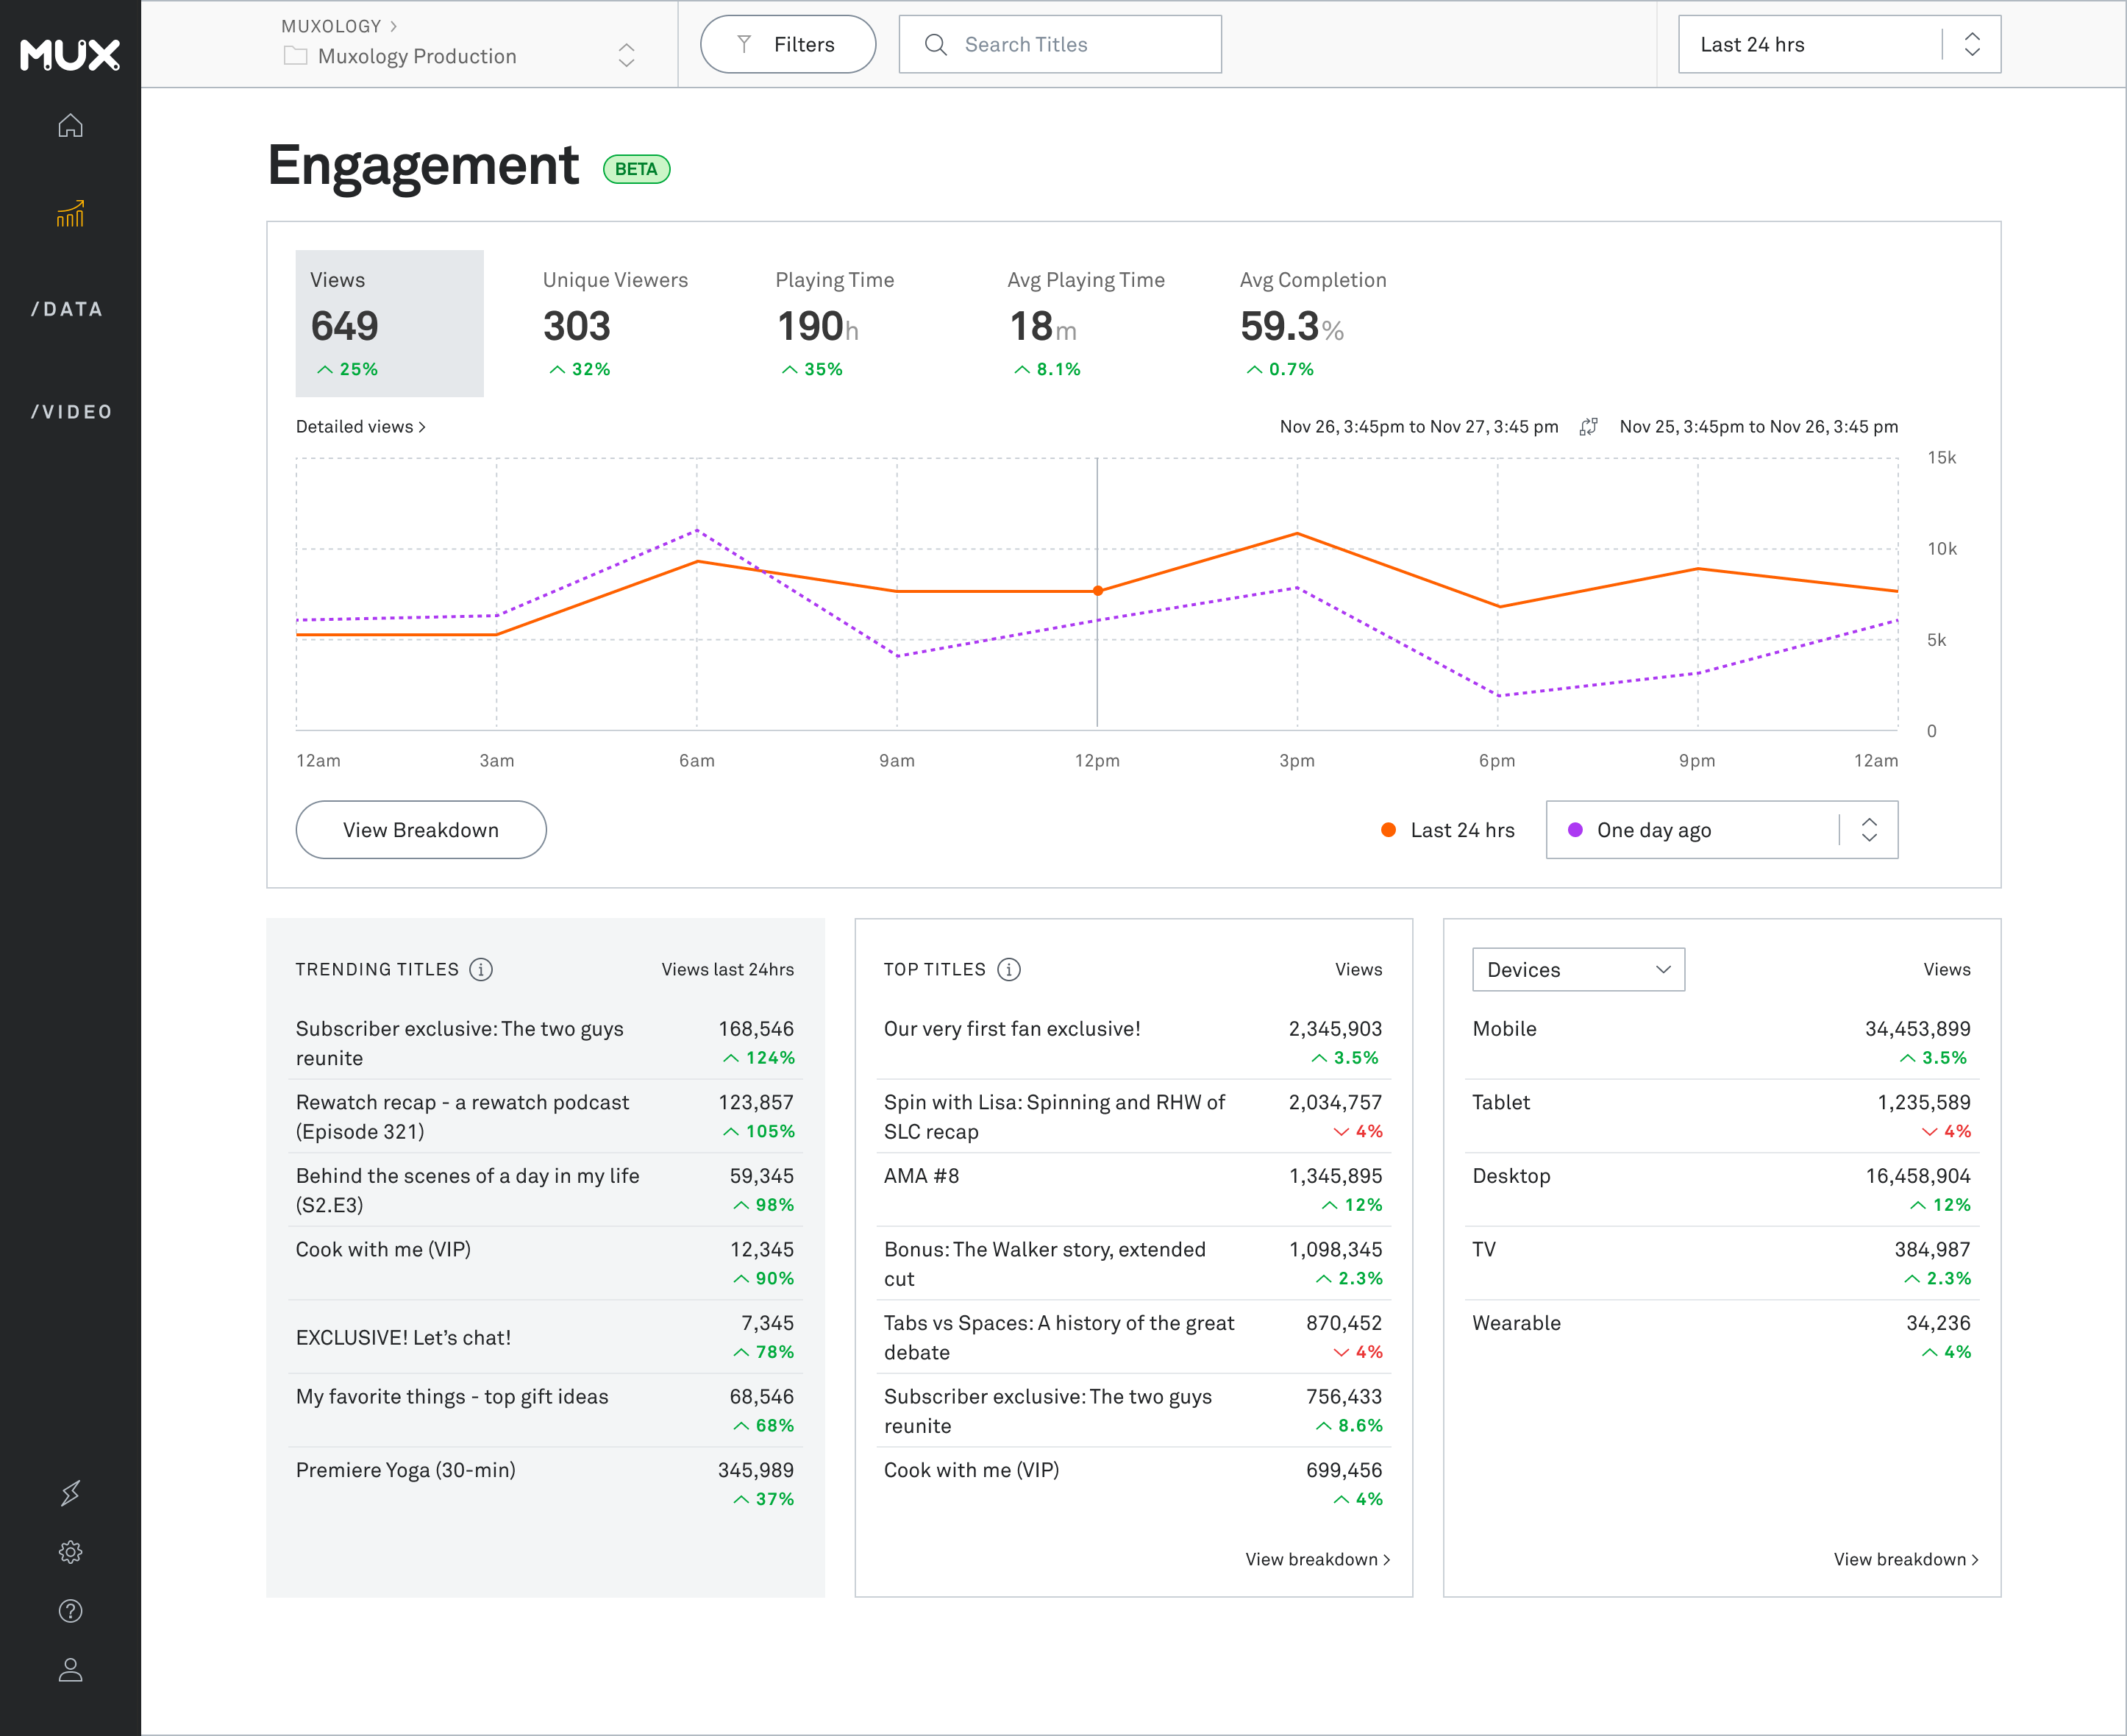
Start by logging into dashboard.mux.com and click on the icon that looks like a bar chart in the upper left of the navigation menu. This will pull up the Engagement Overview Dashboard which provides an at-a-glance view of your key engagement metrics.
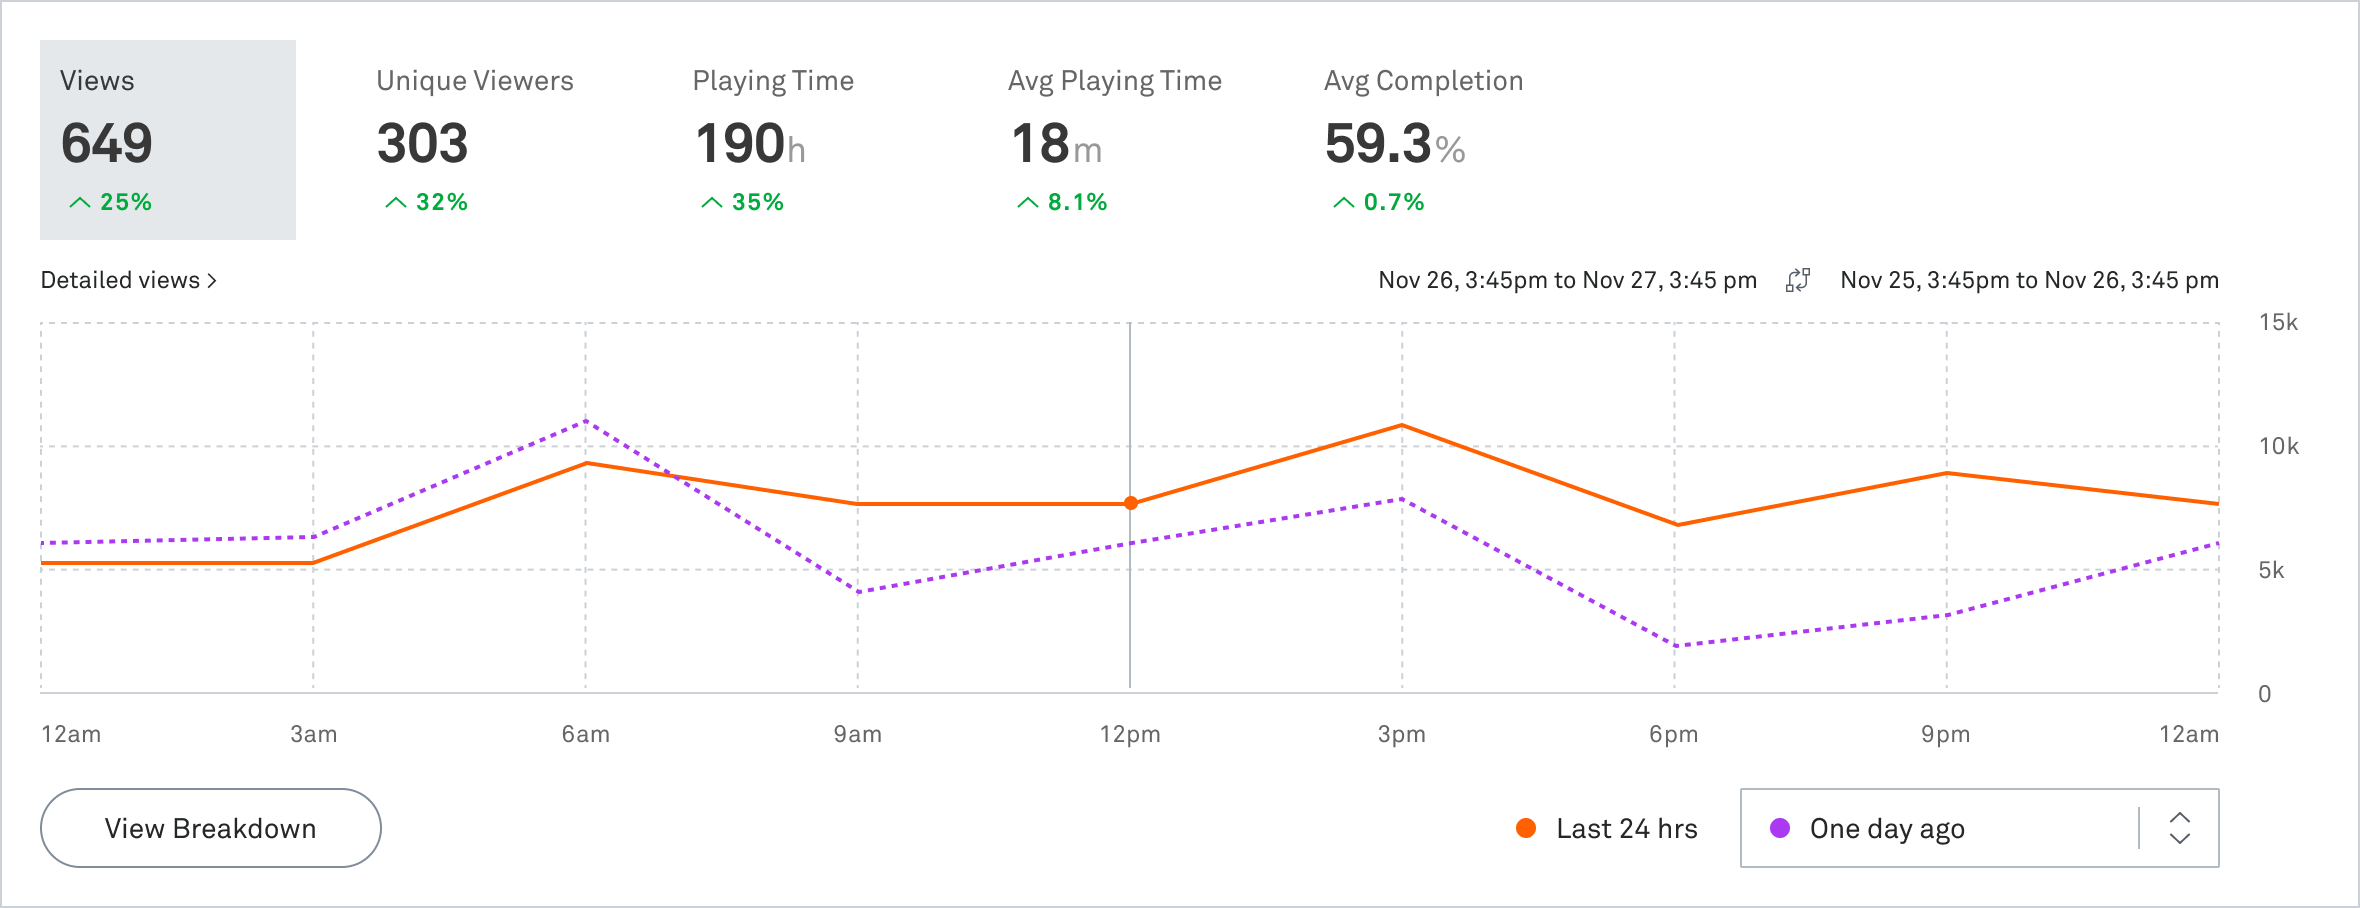
You’ll notice old favorites like Views, Unique Viewers, and Playing Time. Now we’ve also added what we hope will be new favorites including Average Playing Time per viewer and Average Completion Percentage.
Average Playing Time divides the Total Playing Time by the Total Views. Average Completion Percentage measures the Average Playing Time divided by the average content duration.

Click on any top-line metrics and it will adjust the chart to show you that data over the selected time period. Select a comparison time frame to help contextualize trends in your data. For example, if you are looking at your engagement data for the last 30 days, you might want to compare it with the previous 30-day period. This will also show the percentage change so you can easily see how they compare in aggregate with the previous period.

Finding your best and (worst) performing videos
When you are trying to understand how your videos are performing, you want to get a sense of which videos are performing better (and worse) than others. You might be figuring out which instructor classes have the most appeal or trying to see which viral trend is driving excitement. The Engagement Overview showcases both top video titles for the selected time period as well as the trending titles for the last 24 hours.
Trending titles is a new metric we’re introducing with this dashboard. It helps you understand which content may not have reached the top of your views list but is starting to gain momentum. You can click any of the titles in this list for a deeper look at that particular video.
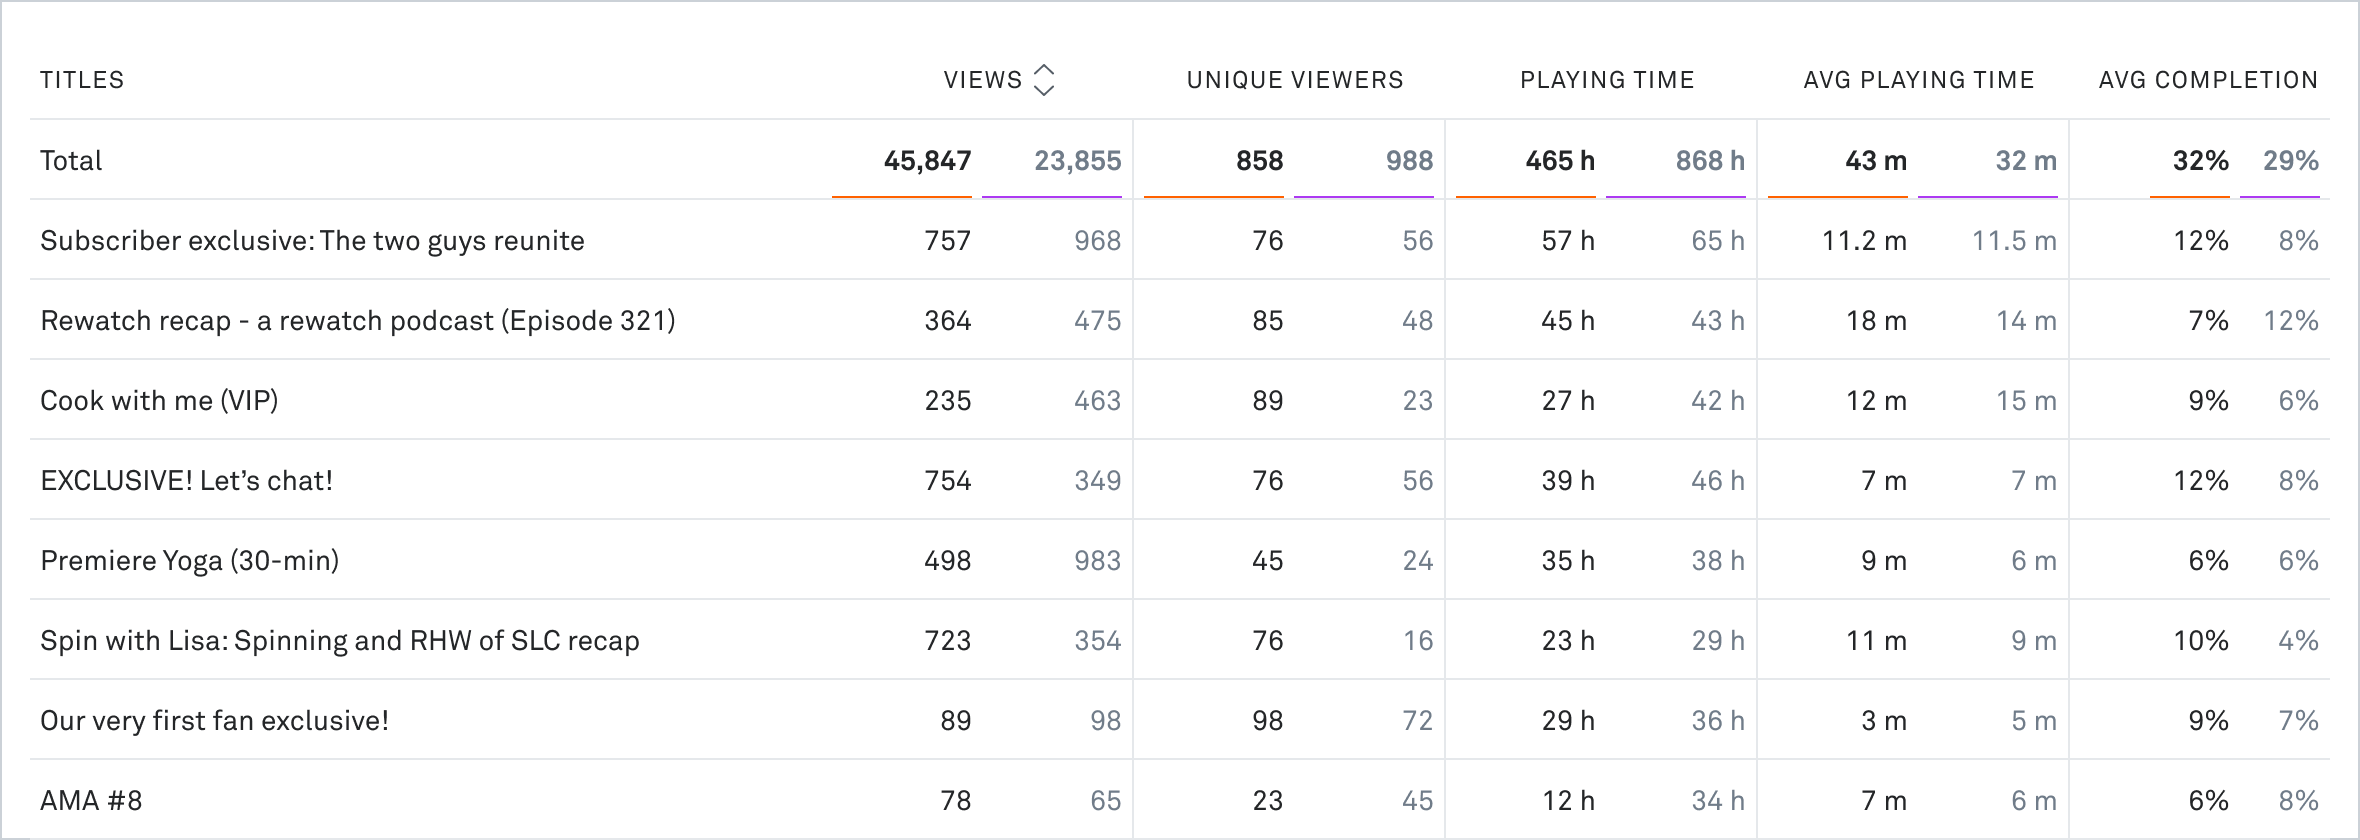
You can also see a more comprehensive breakdown of your titles. When you’ve reached a slice of data that you find interesting in your top-line metrics, you can click on Breakdown which will provide a detailed view breaking your engagement metrics by title, device, OS, or geography. If you’ve selected a comparison period, you’ll see your engagement metrics for both periods side by side in the breakdown details and in the overview graph.

Not seeing your video titles? Currently, the process to see video titles in Mux Data is to configure your Mux Data SDK or Mux Player SDK to pass your video title. If you’re a Mux Video customer, fear not! Our team is hard at work on improving support for video titles. Keep an eye out for more information.
Digging into the details of a specific video
Select a specific video by clicking on its name or searching for a title and you’ll be brought to the engagement details for that video.
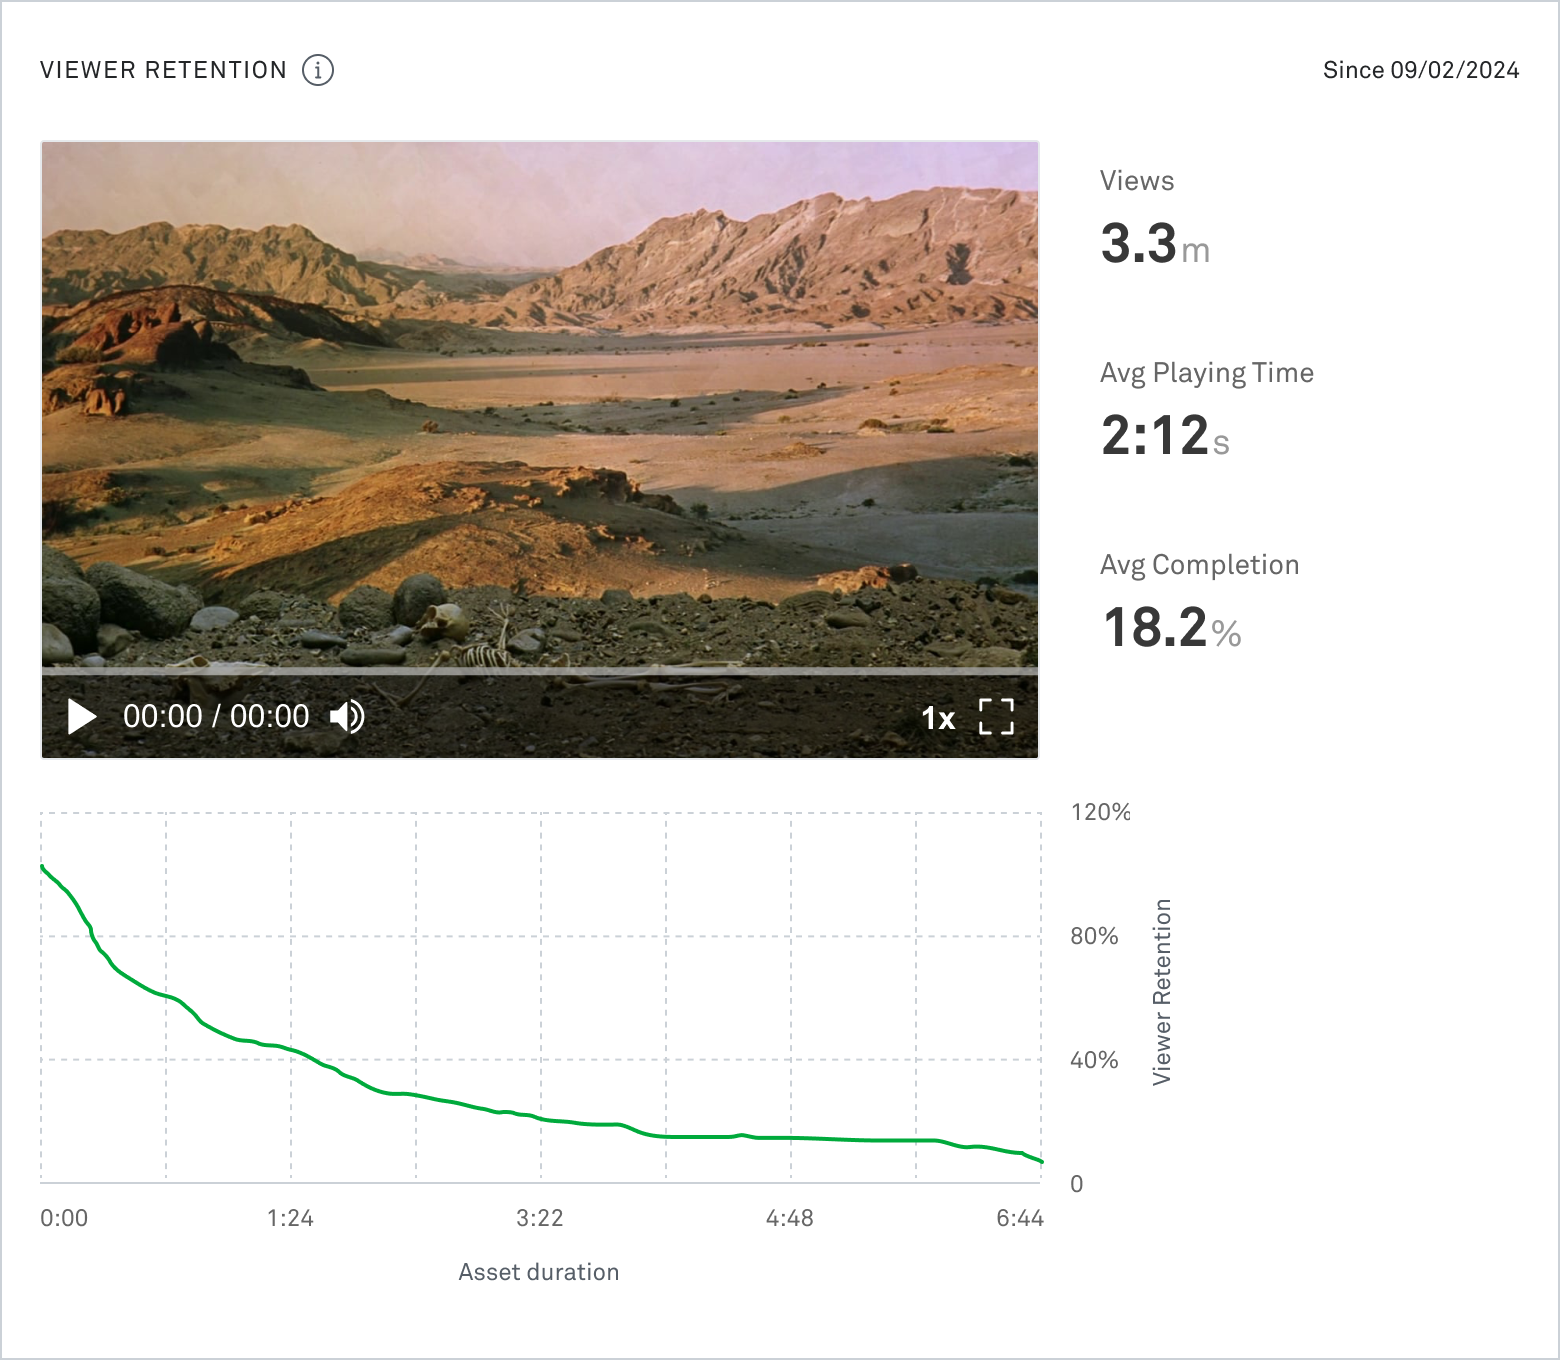
This view features a new section focused on audience retention. Viewer Retention helps you understand the engagement for that specific video for the full 100 days of data. It includes total views, average playing time, and average completion rate for the 100 days.

It also includes a new chart that visualizes the average completion percentage measured across the content duration. This makes it easy to assess where viewers drop off while watching your video.
What’s next?
We’re releasing the Mux Engagement into beta, which means we’ll continue to make tweaks and improvements to create the best experience for you.
But we’re not stopping with just a dashboard. As we continue to invest in video engagement, we’ll be working on adding new metrics to our API and easy ways of adding metadata, such as video title, in Mux Video. If you want to stay informed about the work we’re doing with Engagement, sign up here.