By Aurélien Bibaut, Winston Chou, Simon Ejdemyr, and Nathan Kallus

We are excited to share our work on how to learn good proxy metrics from historical experiments at KDD 2024. This work addresses a fundamental question for technology companies and academic researchers alike: how do we establish that a treatment that improves short-term (statistically sensitive) outcomes also improves long-term (statistically insensitive) outcomes? Or, faced with multiple short-term outcomes, how do we optimally trade them off for long-term benefit?
For example, in an A/B test, you may observe that a product change improves the click-through rate. However, the test does not provide enough signal to measure a change in long-term retention, leaving you in the dark as to whether this treatment makes users more satisfied with your service. The click-through rate is a proxy metric (S, for surrogate, in our paper) while retention is a downstream business outcome or north star metric (Y). We may even have several proxy metrics, such as other types of clicks or the length of engagement after click. Taken together, these form a vector of proxy metrics.
The goal of our work is to understand the true relationship between the proxy metric(s) and the north star metric — so that we can assess a proxy’s ability to stand in for the north star metric, learn how to combine multiple metrics into a single best one, and better explore and compare different proxies.
Several intuitive approaches to understanding this relationship have surprising pitfalls:
- Looking only at user-level correlations between the proxy S and north star Y. Continuing the example from above, you may find that users with a higher click-through rate also tend to have a higher retention. But this does not mean that a product change that improves the click-through rate will also improve retention (in fact, promoting clickbait may have the opposite effect). This is because, as any introductory causal inference class will tell you, there are many confounders between S and Y — many of which you can never reliably observe and control for.
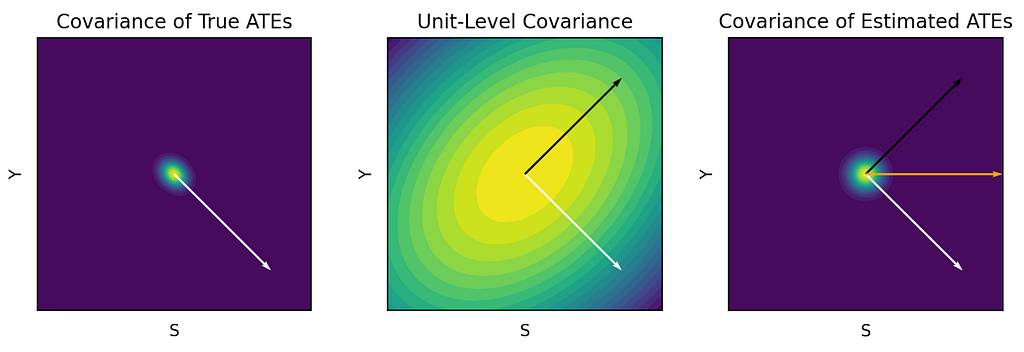
- Looking naively at treatment effect correlations between S and Y. Suppose you are lucky enough to have many historical A/B tests. Further imagine the ordinary least squares (OLS) regression line through a scatter plot of Y on S in which each point represents the (S,Y)-treatment effect from a previous test. Even if you find that this line has a positive slope, you unfortunately cannot conclude that product changes that improve S will also improve Y. The reason for this is correlated measurement error — if S and Y are positively correlated in the population, then treatment arms that happen to have more users with high S will also have more users with high Y.
Between these naive approaches, we find that the second one is the easier trap to fall into. This is because the dangers of the first approach are well-known, whereas covariances between estimated treatment effects can appear misleadingly causal. In reality, these covariances can be severely biased compared to what we actually care about: covariances between true treatment effects. In the extreme — such as when the negative effects of clickbait are substantial but clickiness and retention are highly correlated at the user level — the true relationship between S and Y can be negative even if the OLS slope is positive. Only more data per experiment could diminish this bias — using more experiments as data points will only yield more precise estimates of the badly biased slope. At first glance, this would appear to imperil any hope of using existing experiments to detect the relationship.
To overcome this bias, we propose better ways to leverage historical experiments, inspired by techniques from the literature on weak instrumental variables. More specifically, we show that three estimators are consistent for the true proxy/north-star relationship under different constraints (the paper provides more details and should be helpful for practitioners interested in choosing the best estimator for their setting):
- A Total Covariance (TC) estimator allows us to estimate the OLS slope from a scatter plot of true treatment effects by subtracting the scaled measurement error covariance from the covariance of estimated treatment effects. Under the assumption that the correlated measurement error is the same across experiments (homogeneous covariances), the bias of this estimator is inversely proportional to the total number of units across all experiments, as opposed to the number of members per experiment.
- Jackknife Instrumental Variables Estimation (JIVE) converges to the same OLS slope as the TC estimator but does not require the assumption of homogeneous covariances. JIVE eliminates correlated measurement error by removing each observation’s data from the computation of its instrumented surrogate values.
- A Limited Information Maximum Likelihood (LIML) estimator is statistically efficient as long as there are no direct effects between the treatment and Y (that is, S fully mediates all treatment effects on Y). We find that LIML is highly sensitive to this assumption and recommend TC or JIVE for most applications.
Our methods yield linear structural models of treatment effects that are easy to interpret. As such, they are well-suited to the decentralized and rapidly-evolving practice of experimentation at Netflix, which runs thousands of experiments per year on many diverse parts of the business. Each area of experimentation is staffed by independent Data Science and Engineering teams. While every team ultimately cares about the same north star metrics (e.g., long-term revenue), it is highly impractical for most teams to measure these in short-term A/B tests. Therefore, each has also developed proxies that are more sensitive and directly relevant to their work (e.g., user engagement or latency). To complicate matters more, teams are constantly innovating on these secondary metrics to find the right balance of sensitivity and long-term impact.
In this decentralized environment, linear models of treatment effects are a highly useful tool for coordinating efforts around proxy metrics and aligning them towards the north star:
- Managing metric tradeoffs. Because experiments in one area can affect metrics in another area, there is a need to measure all secondary metrics in all tests, but also to understand the relative impact of these metrics on the north star. This is so we can inform decision-making when one metric trades off against another metric.
- Informing metrics innovation. To minimize wasted effort on metric development, it is also important to understand how metrics correlate with the north star “net of” existing metrics.
- Enabling teams to work independently. Lastly, teams need simple tools in order to iterate on their own metrics. Teams may come up with dozens of variations of secondary metrics, and slow, complicated tools for evaluating these variations are unlikely to be adopted. Conversely, our models are easy and fast to fit, and are actively used to develop proxy metrics at Netflix.
We are thrilled about the research and implementation of these methods at Netflix — while also continuing to strive for great and always better, per our culture. For example, we still have some way to go to develop a more flexible data architecture to streamline the application of these methods within Netflix. Interested in helping us? See our open job postings!
For feedback on this blog post and for supporting and making this work better, we thank Apoorva Lal, Martin Tingley, Patric Glynn, Richard McDowell, Travis Brooks, and Ayal Chen-Zion.
Improve Your Next Experiment by Learning Better Proxy Metrics From Past Experiments was originally published in Netflix TechBlog on Medium, where people are continuing the conversation by highlighting and responding to this story.