Debugging download initiator
Read the original on phpied.com ↗I was recently debugging why an image was being downloaded. In Chrome devtools, in the network panel, the column for "initiator" was pointing to the end of the HTML document. But that wasn't true and I suspect when Chrome gives up on trying to figure out the actual code location, the default is the HTML document.
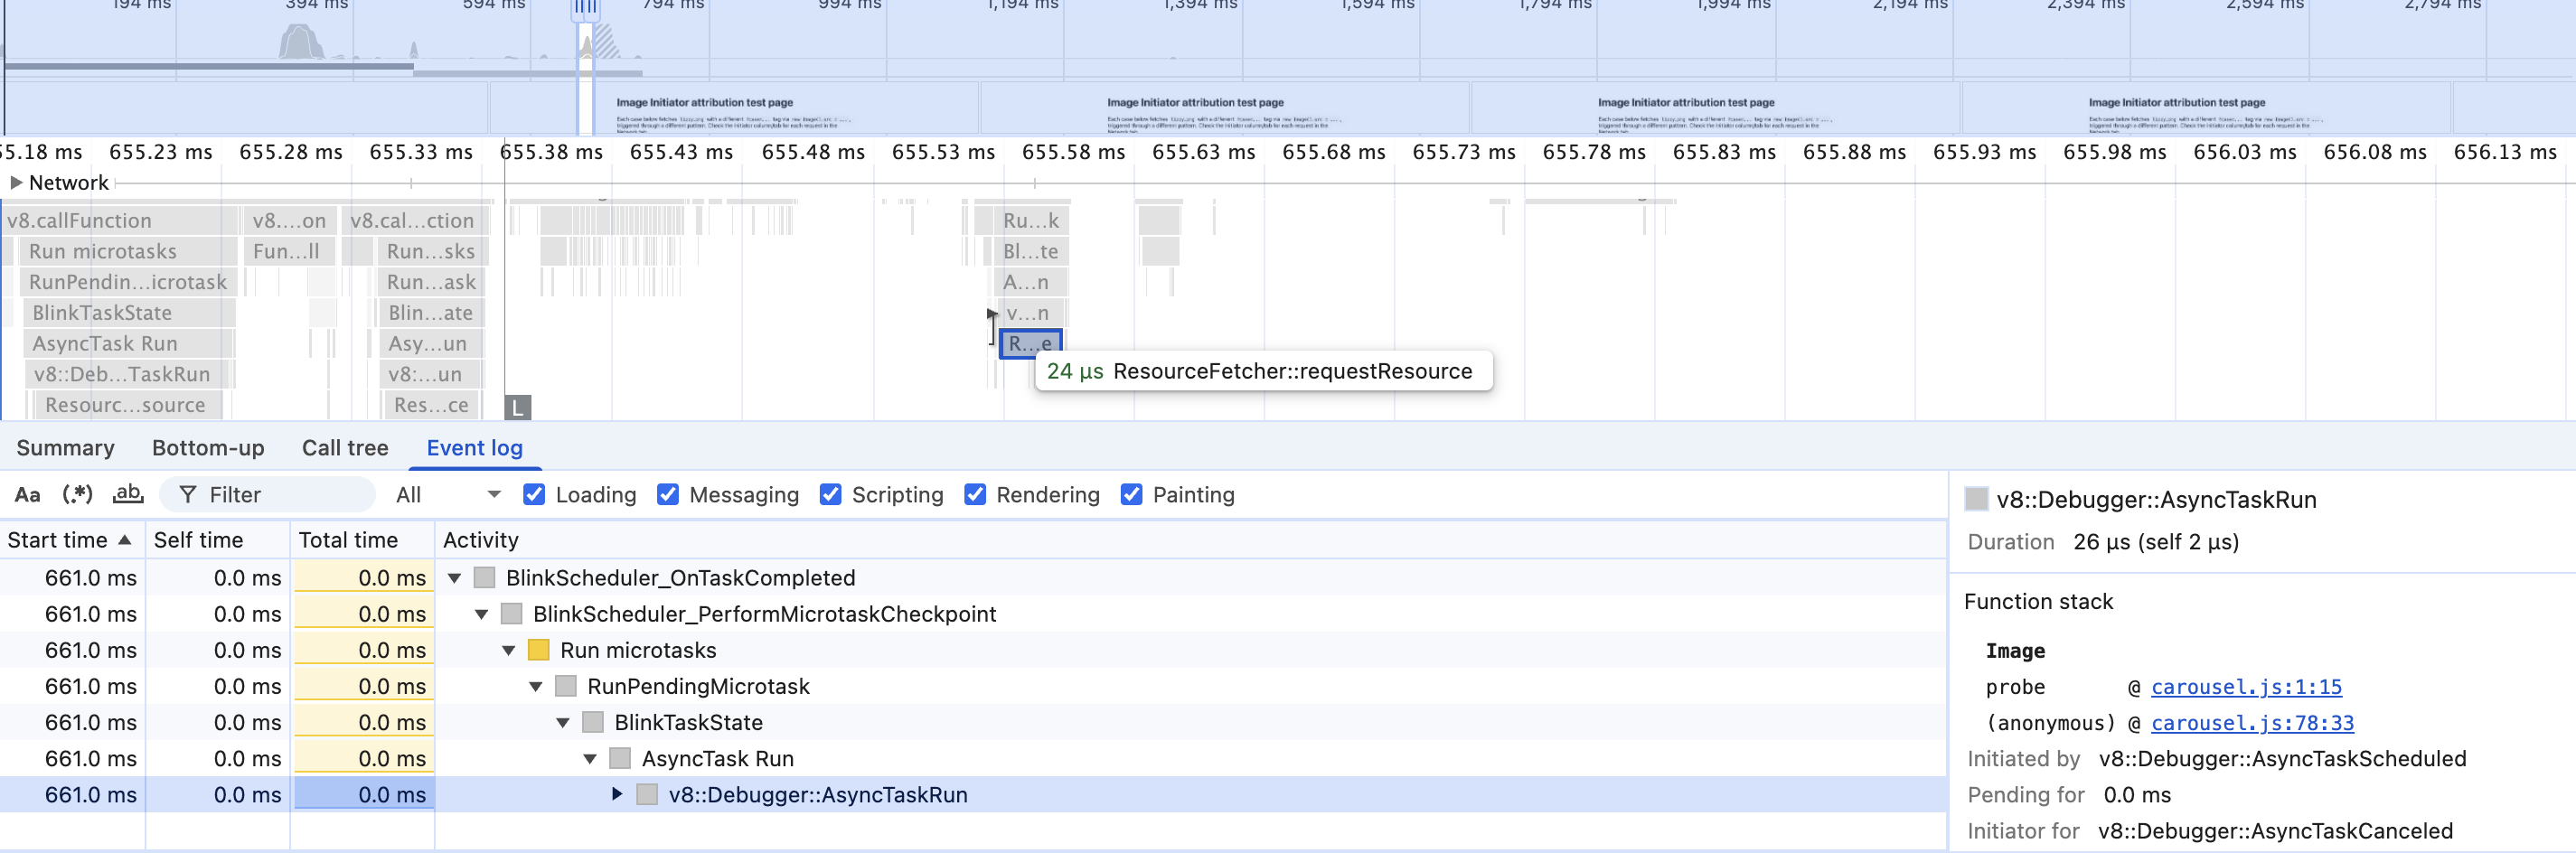
So that was unhelpful, but using the Performance profiler, I was able to find the initiating JavaScript pretty quickly. And then I was wondering, why did devtools point me in the wrong direction. So I set up a test page with various ways to load an image from JavaScript and see where devtools falls apart.
Here is the test page if you want to play with it yourself.
Chrome
Eventually, I narrowed down the problem to be caused by yielding. Using scheduler.yield() is a great way to break up long tasks. But somewhere along the way devtools' Network panel loses the initiator.
Here's a screenshot of the network panel loading the page while disabling the cache:
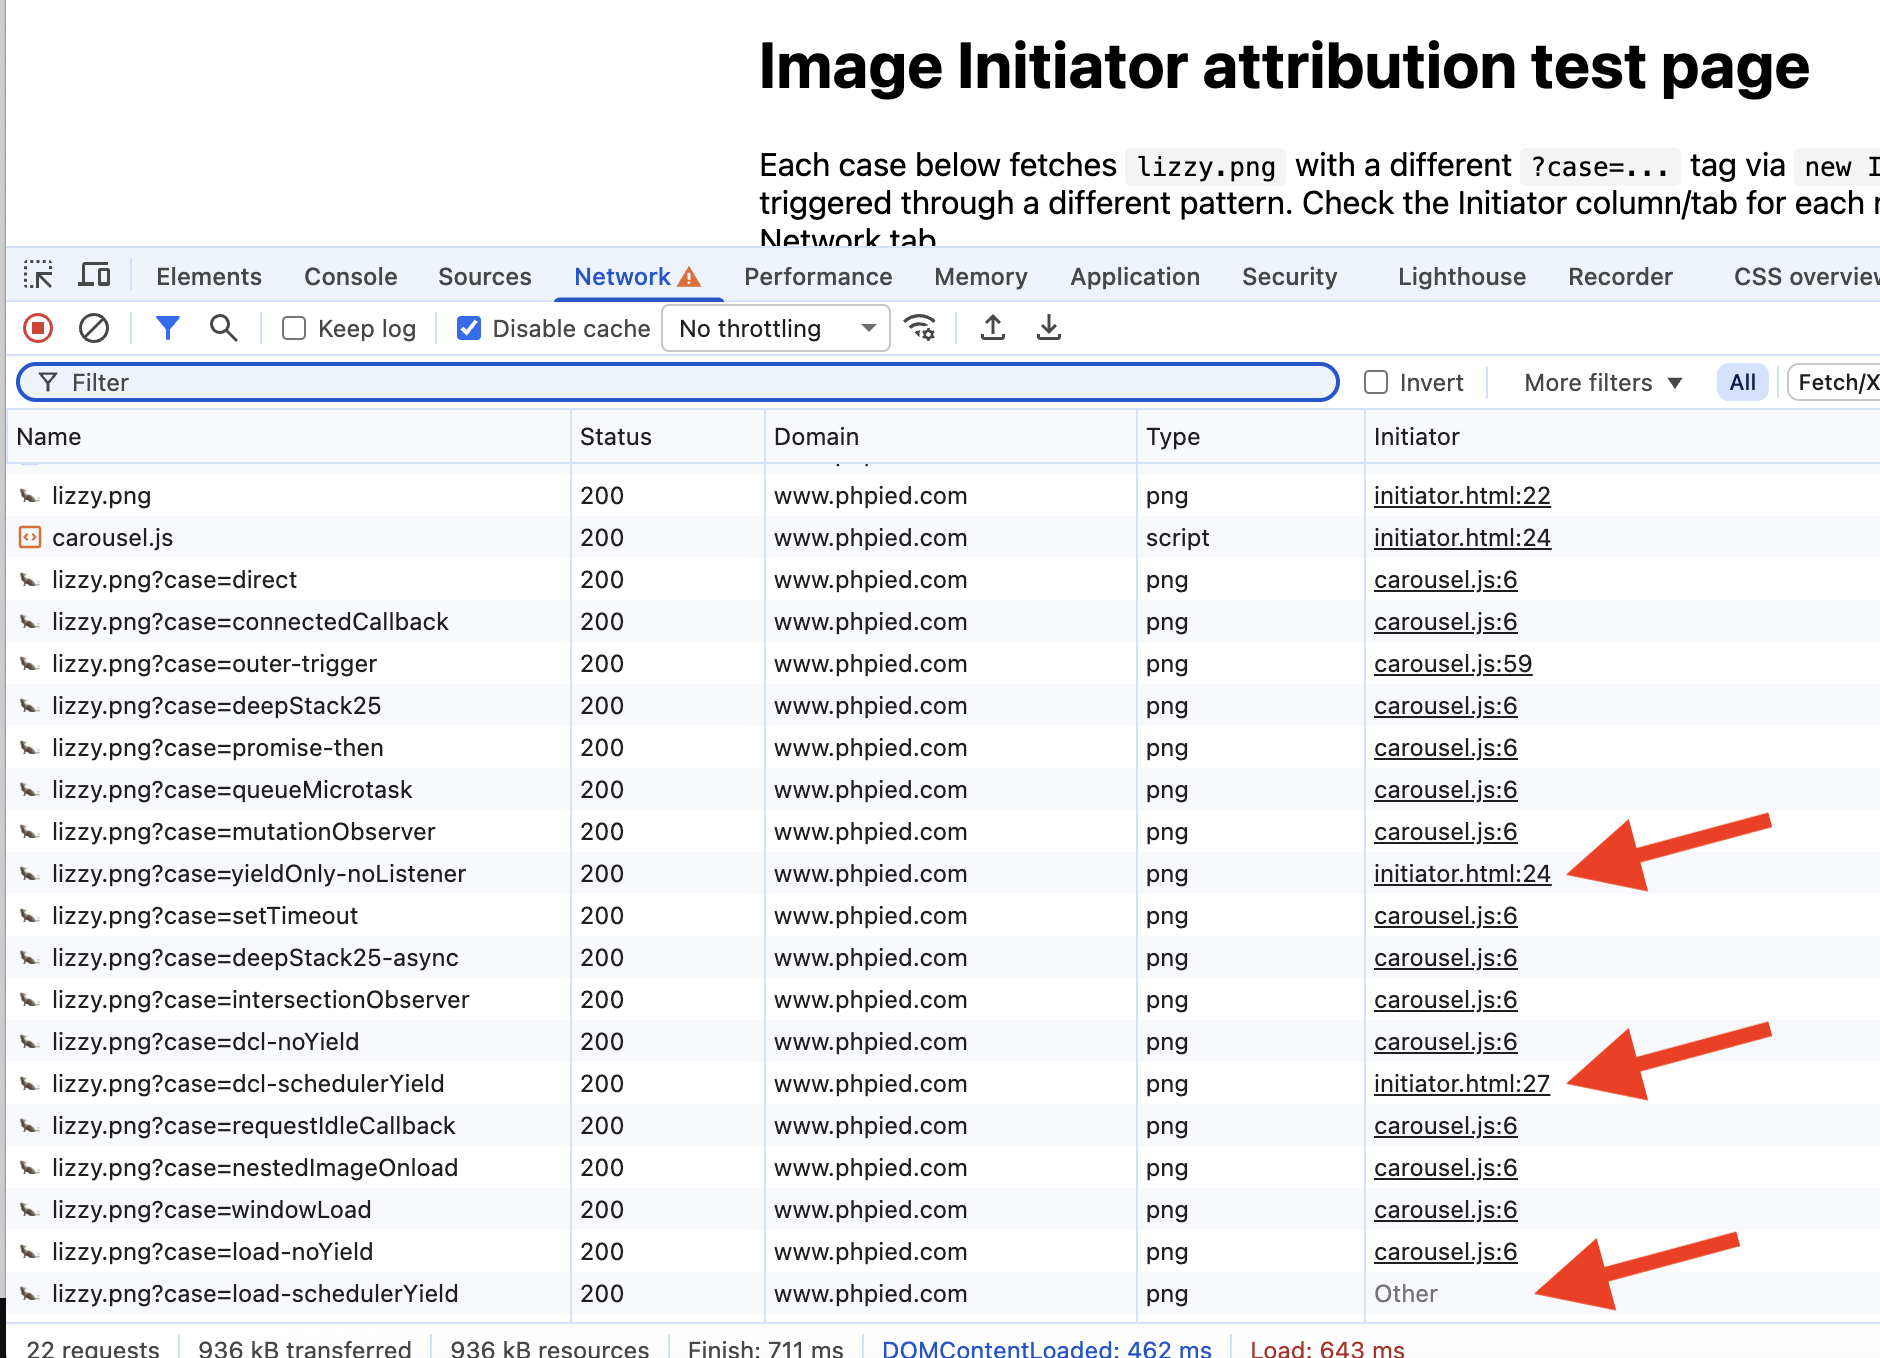
Two of the loading patterns (yielding in a DOMContentLoaded event listener and just normal yielding) no longer point to the JavaScript that's loading the images. Instead, one is pointing to the line in the HTML that loads the JavaScript and the other one is pointing to the line after the end of the HTML content. And another one of the patterns, namely, yielding in an onload handler completely gives up and just says "Other".
Here's a screenshot with the cache enabled:
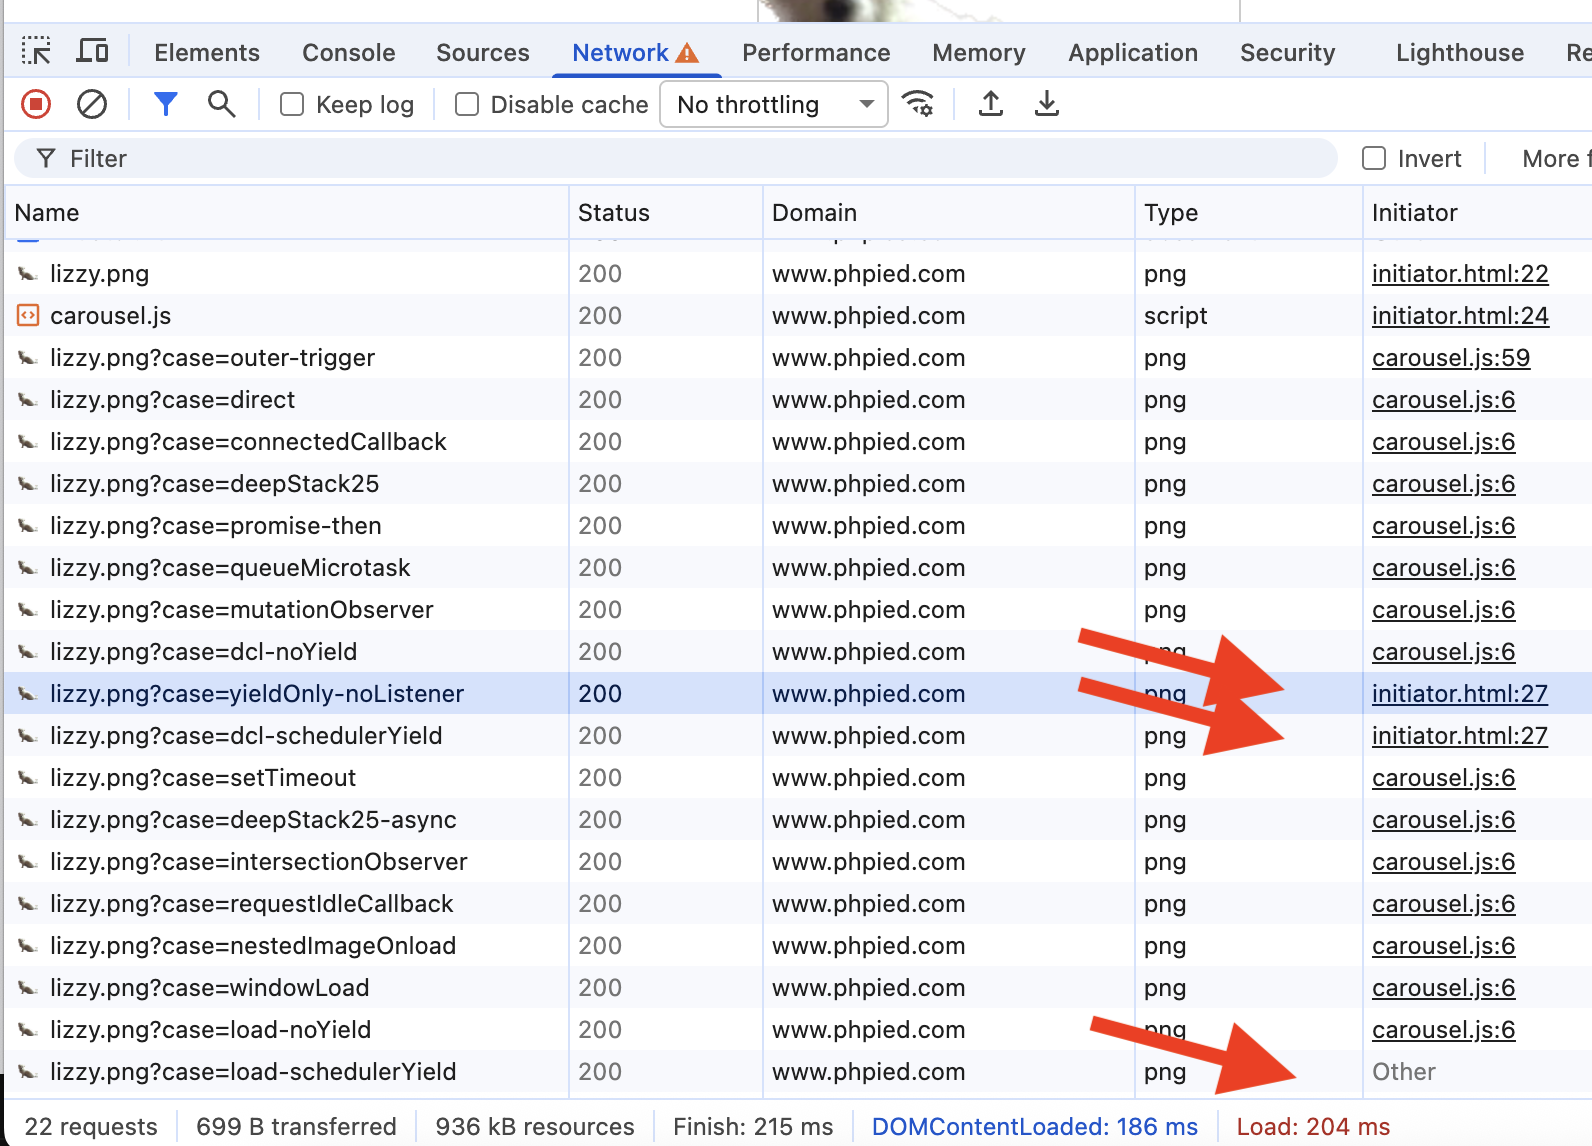
Pretty much the same, except the inline yield is now pointing to the end of the HTML.
Firefox
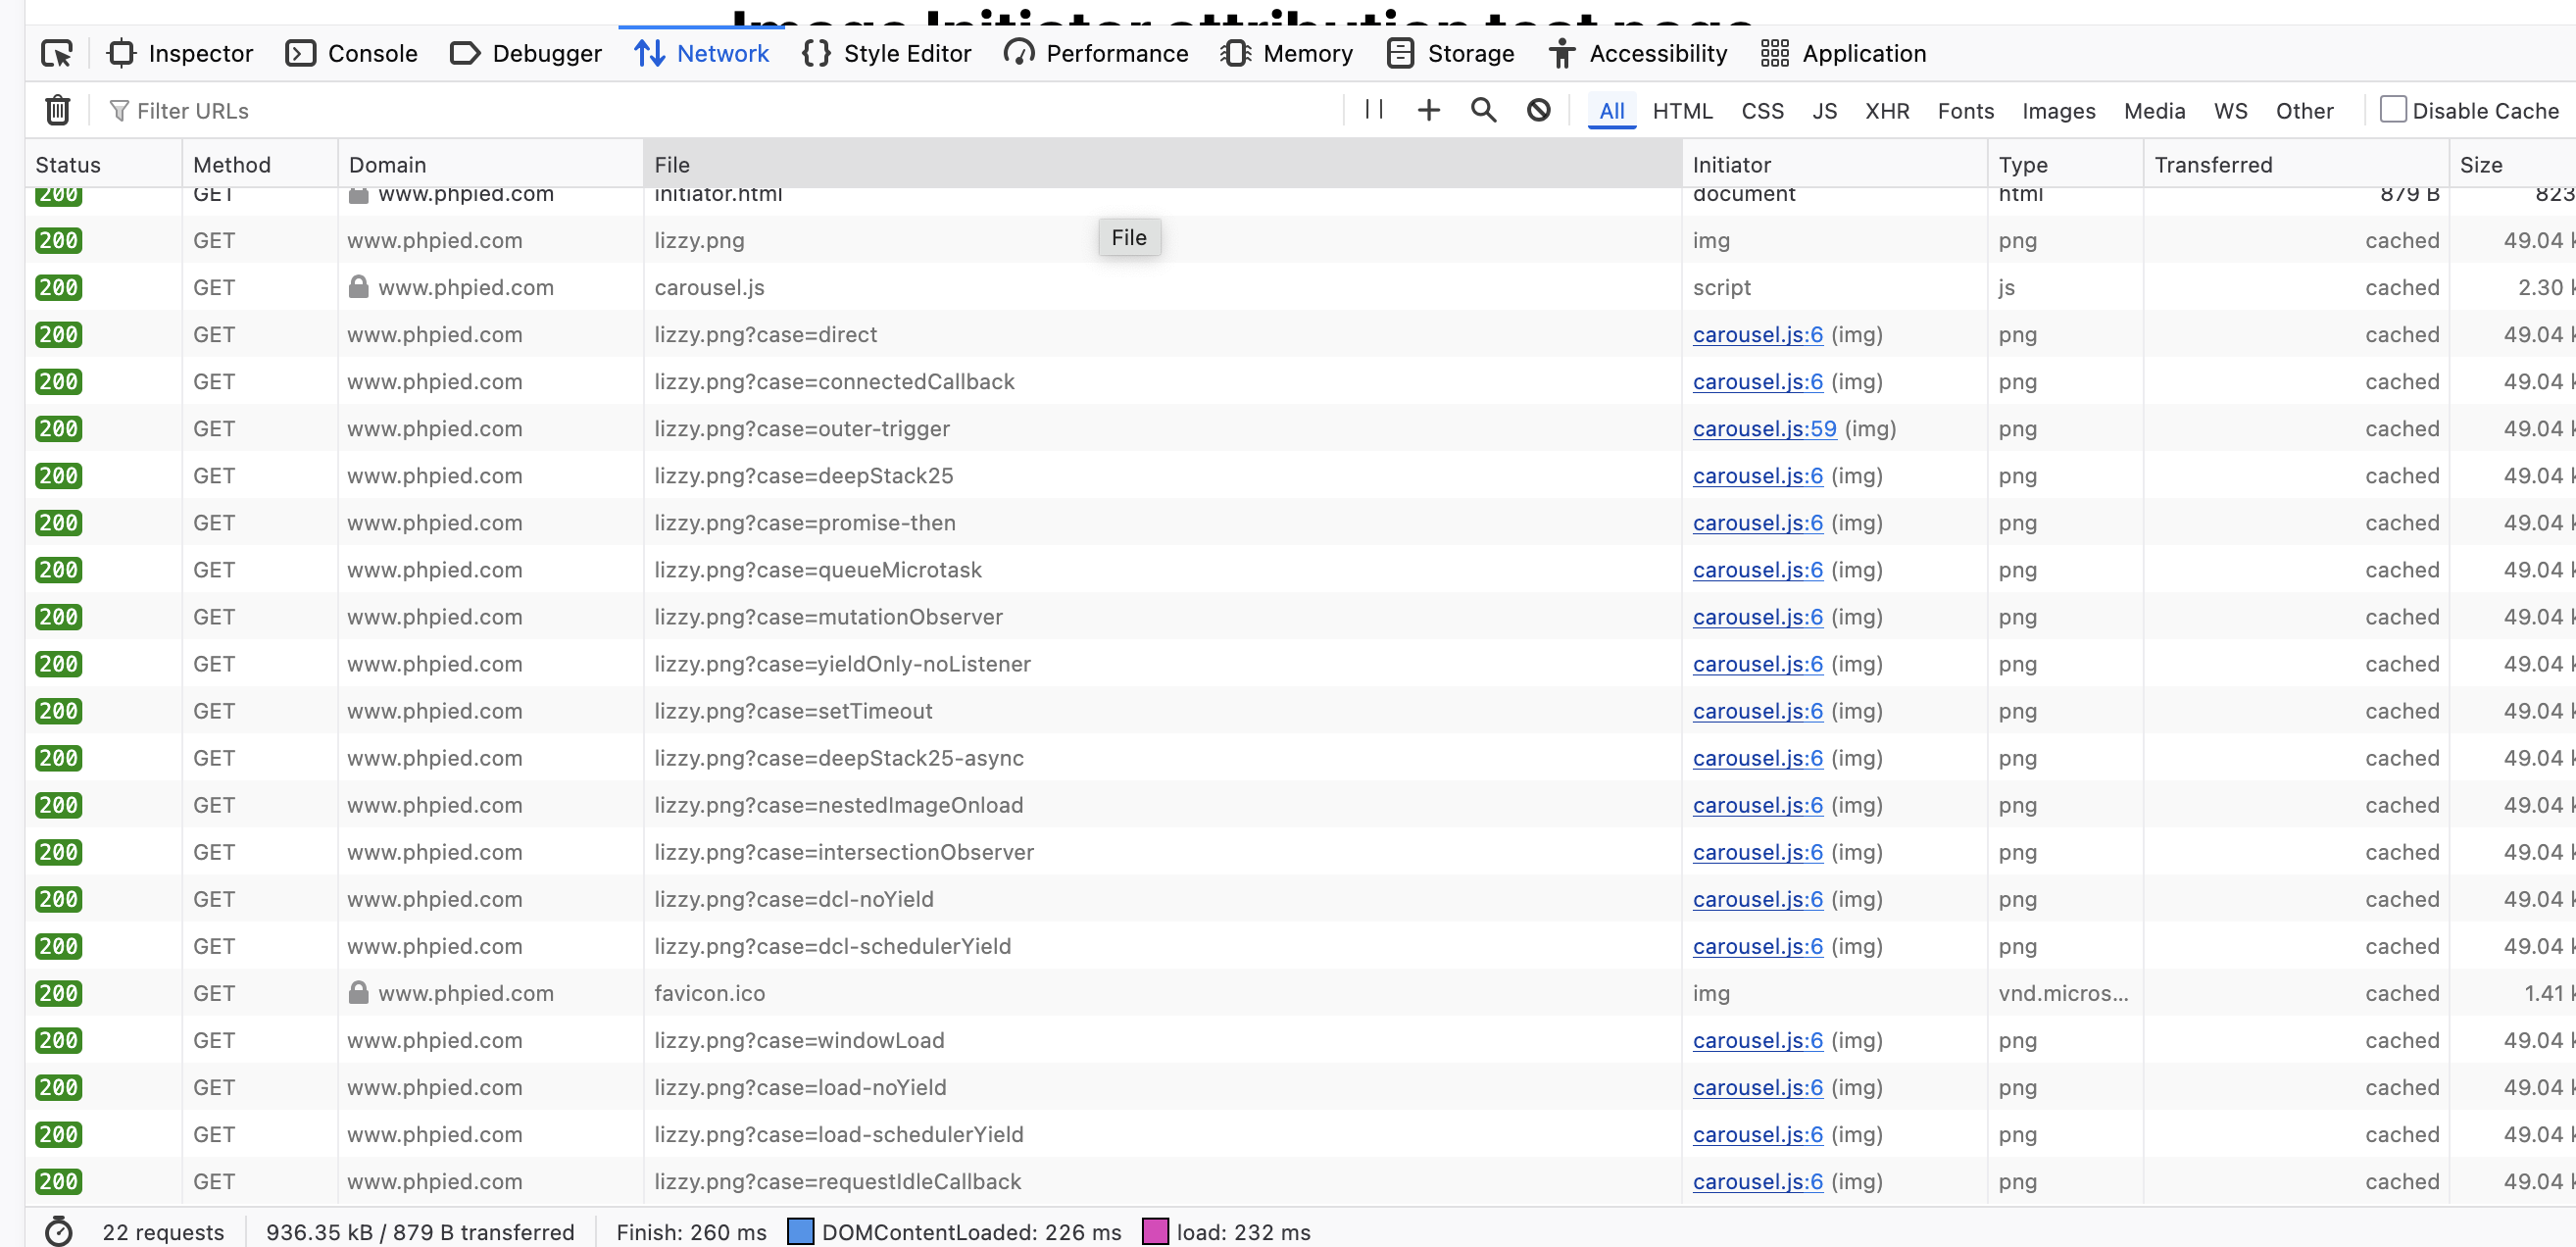
And what about Firefox? It's perfect when all the responses are cached:
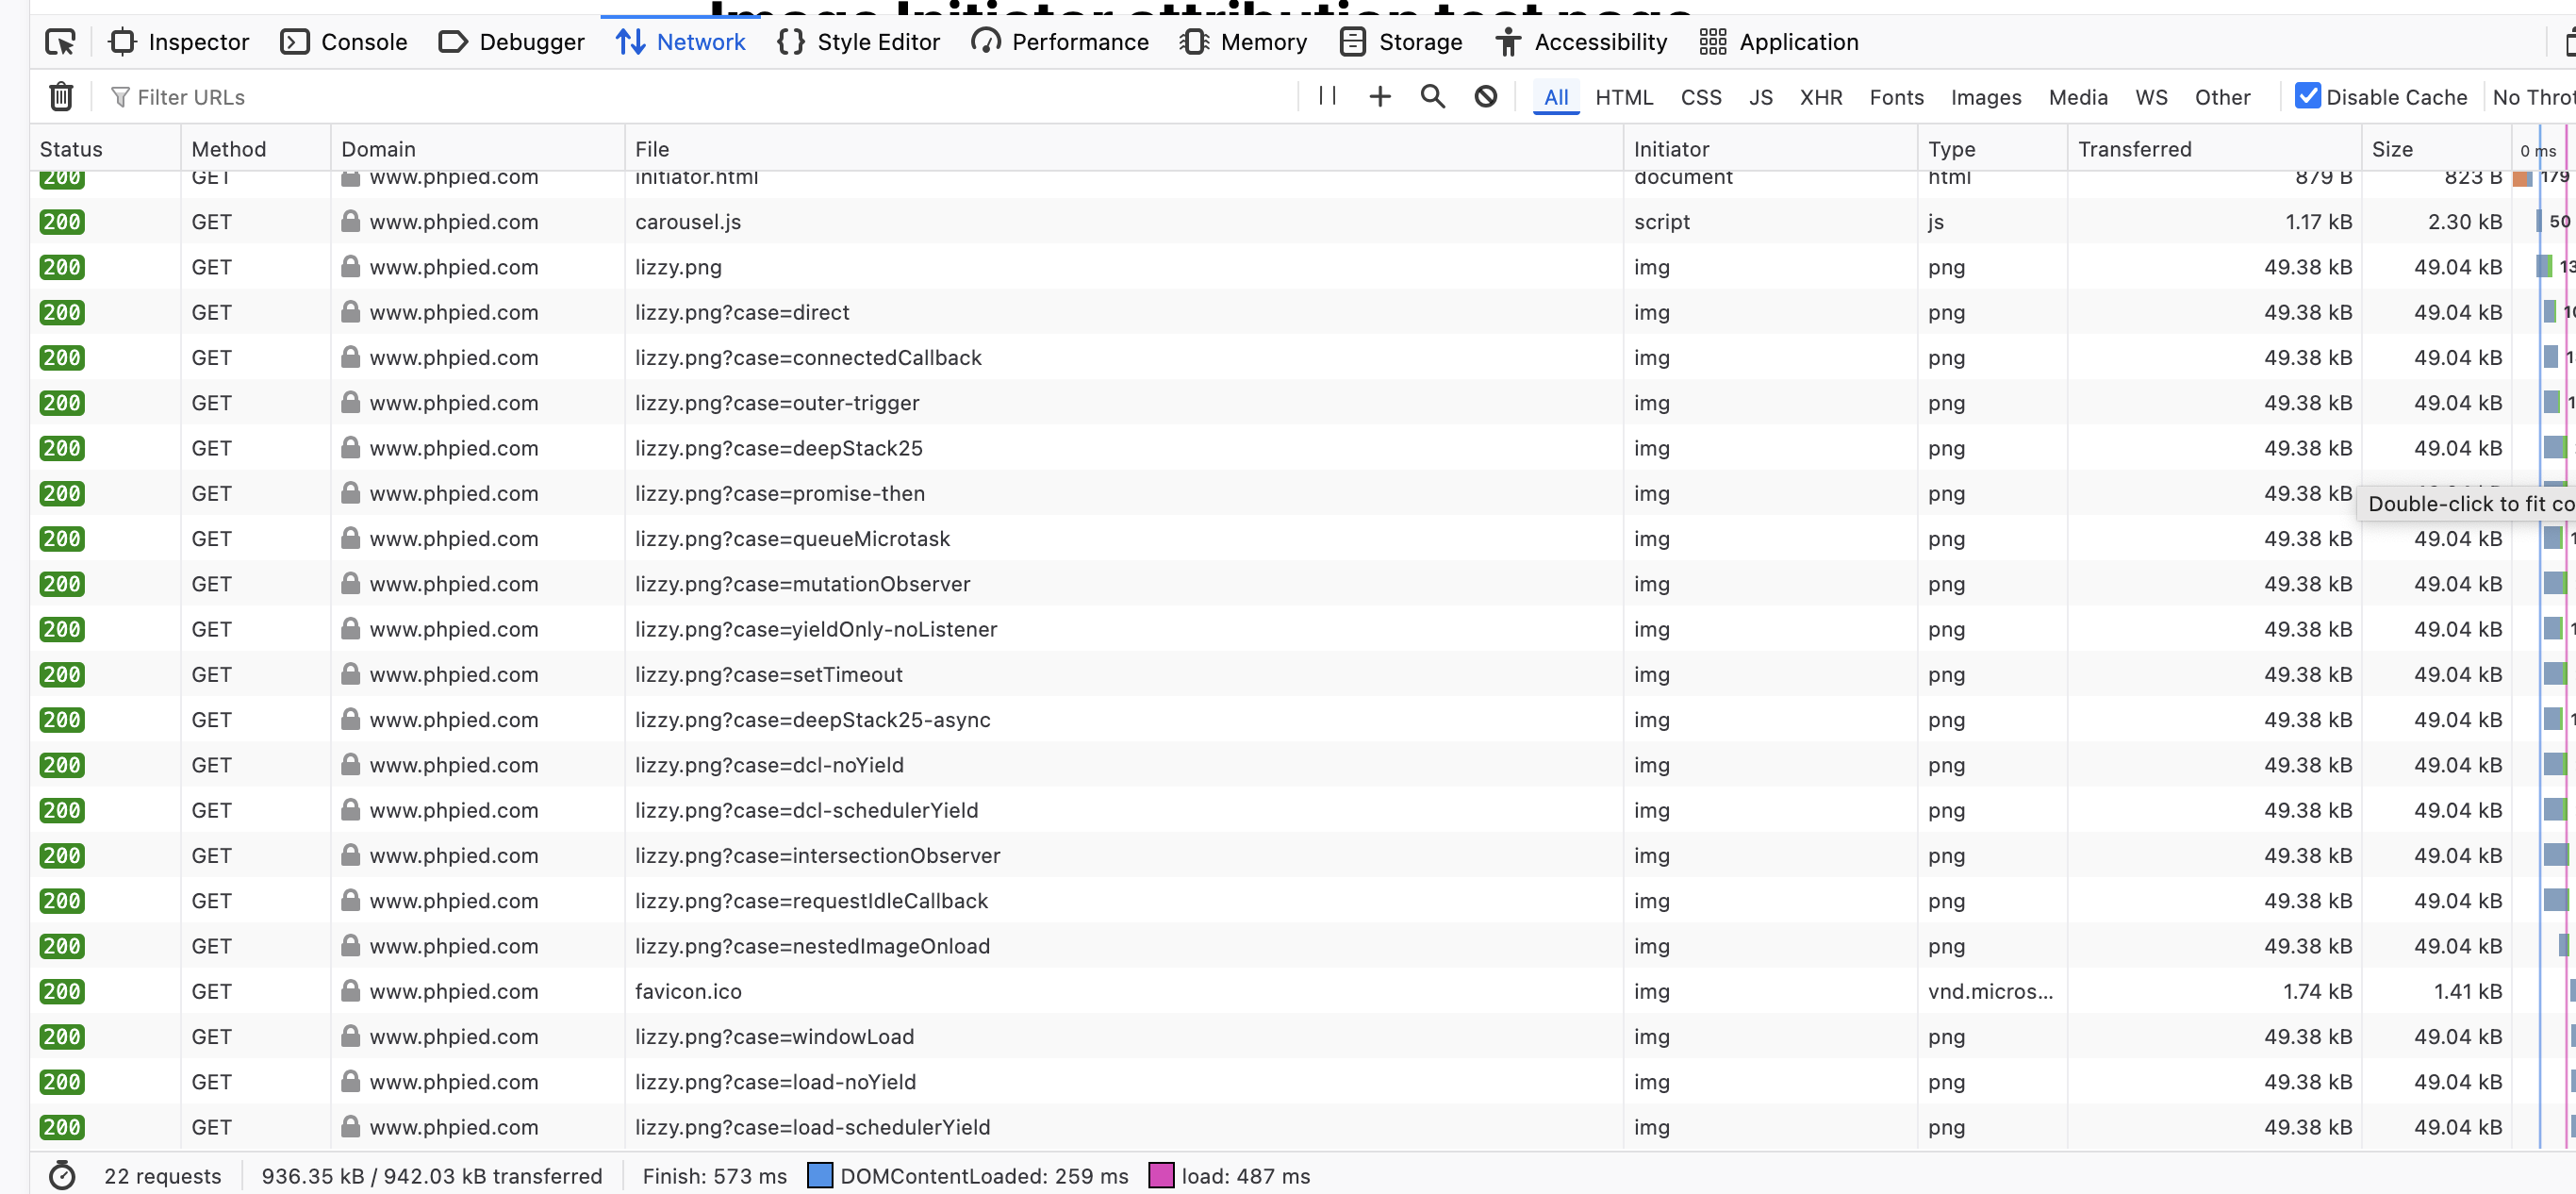
And not very helpful img when they are not:
Profiler
Using the profiler, you can find the real initiator pretty quickly. All you need to do is search for the file name of the image, look at where the resource download is being scheduled and follow the log trail.
So... what?
I think this can be considered a bug in devtools, or at least a potential enhancement. I'm hoping to put this in front of some chrome engineers' eyes.