Every year feels like a big year here at SpeedCurve, and 2024 was no exception. Here's a recap of product highlights designed to make your performance monitoring even better and easier!

Our biggest achievements this year have centred on making it easier for you to:
- Gather more meaningful real user monitoring (RUM) data
- Get actionable insights from Core Web Vitals
- Simplify your synthetic testing
- Get expert performance coaching when and how you need it
Keep reading to learn more...
INP replaced FID
In the spring, Google made it official: Interaction to Next Paint replaced First Input Delay as the responsiveness metric in Core Web Vitals (the trifecta of performance metrics that are a key ingredient in Google's search ranking algorithm).
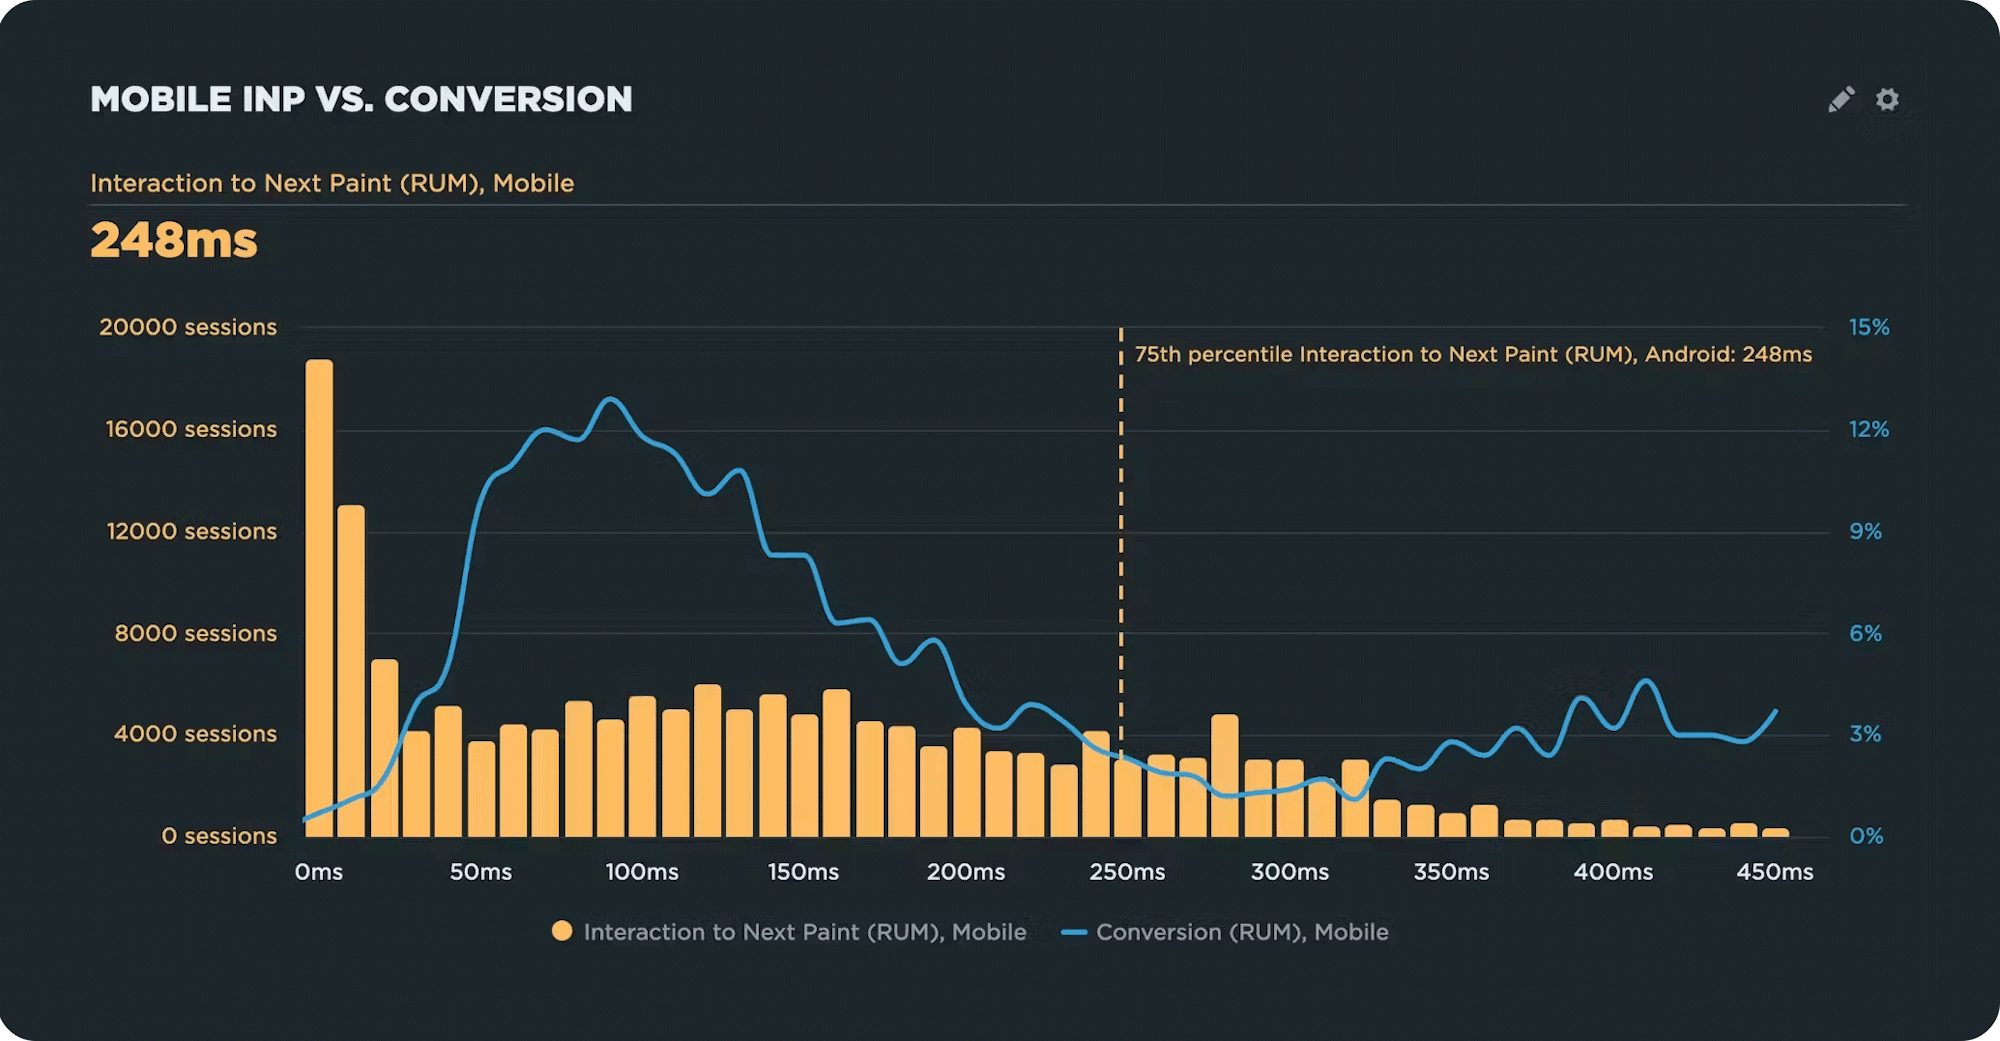
Correlation chart demonstrating that as INP gets worse, so does conversion rate for mobile users
We've been tracking INP since well before Google made the announcement, so SpeedCurve users didn't have to scramble to switch over to a new metric. Because we've been tracking INP for a while, we were able to share some insights that our users found helpful, such as:
- While INP changes typically correlate to changes in metrics like bounce rate and conversion rate, the results vary from site to site
- Mobile INP has an even stronger correlation to bounce rate and conversions than desktop INP (see chart above)
- There's no consistent correlation with Google's thresholds for 'Good' and 'Poor'
The main takeaway: While Google's recommended thresholds for 'Good' INP are a helpful starting point, you need to look at your own data, filter desktop and mobile traffic separately, and see how your INP results correlate to your own business and user engagement metrics. That's the most reliable way to ensure that you're creating meaningful performance goals for your pages.
RUM attribution and subparts for INP and LCP
Last May, we introduced more diagnostic detail for INP, to match the diagnostic depth we offer for Largest Contentful Paint (LCP). We made it easier to identify which user interactions are responsible for INP issues. We also started collecting performance data for INP subparts (which we also collect for LCP subparts), so you can understand exactly where interaction time is being spent.
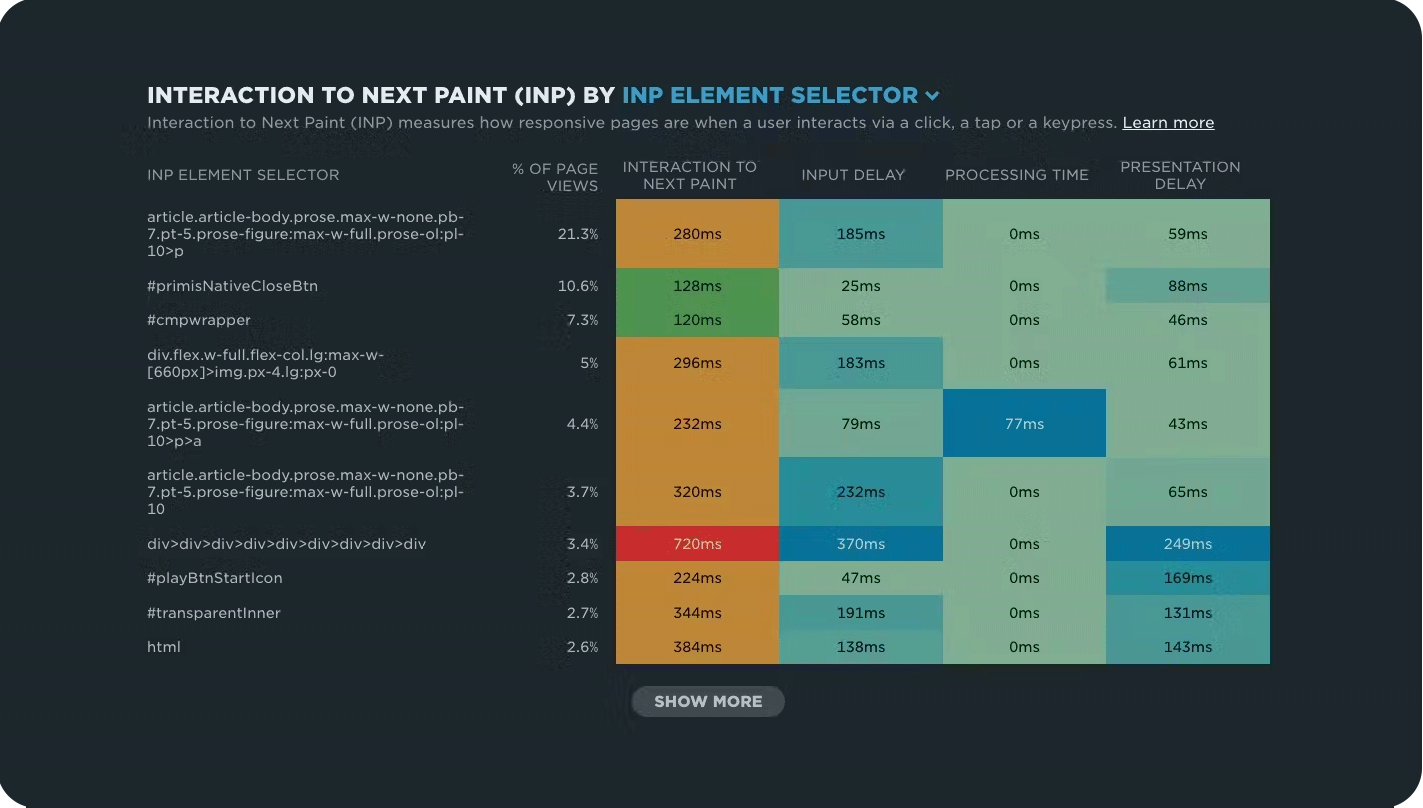
This detailed walkthrough shows you how to make more meaningful and intuitive attributions for your RUM metrics (like INP and LCP) – which makes it much easier for you to zero in on your performance issues.
Re-vital-ized Vitals dashboard
Since we first launched the Vitals dashboard back in December of 2020, we've heard from many of you who want to expand the scope of the dashboard to include other meaningful metrics that are not technically considered Core Web Vitals.
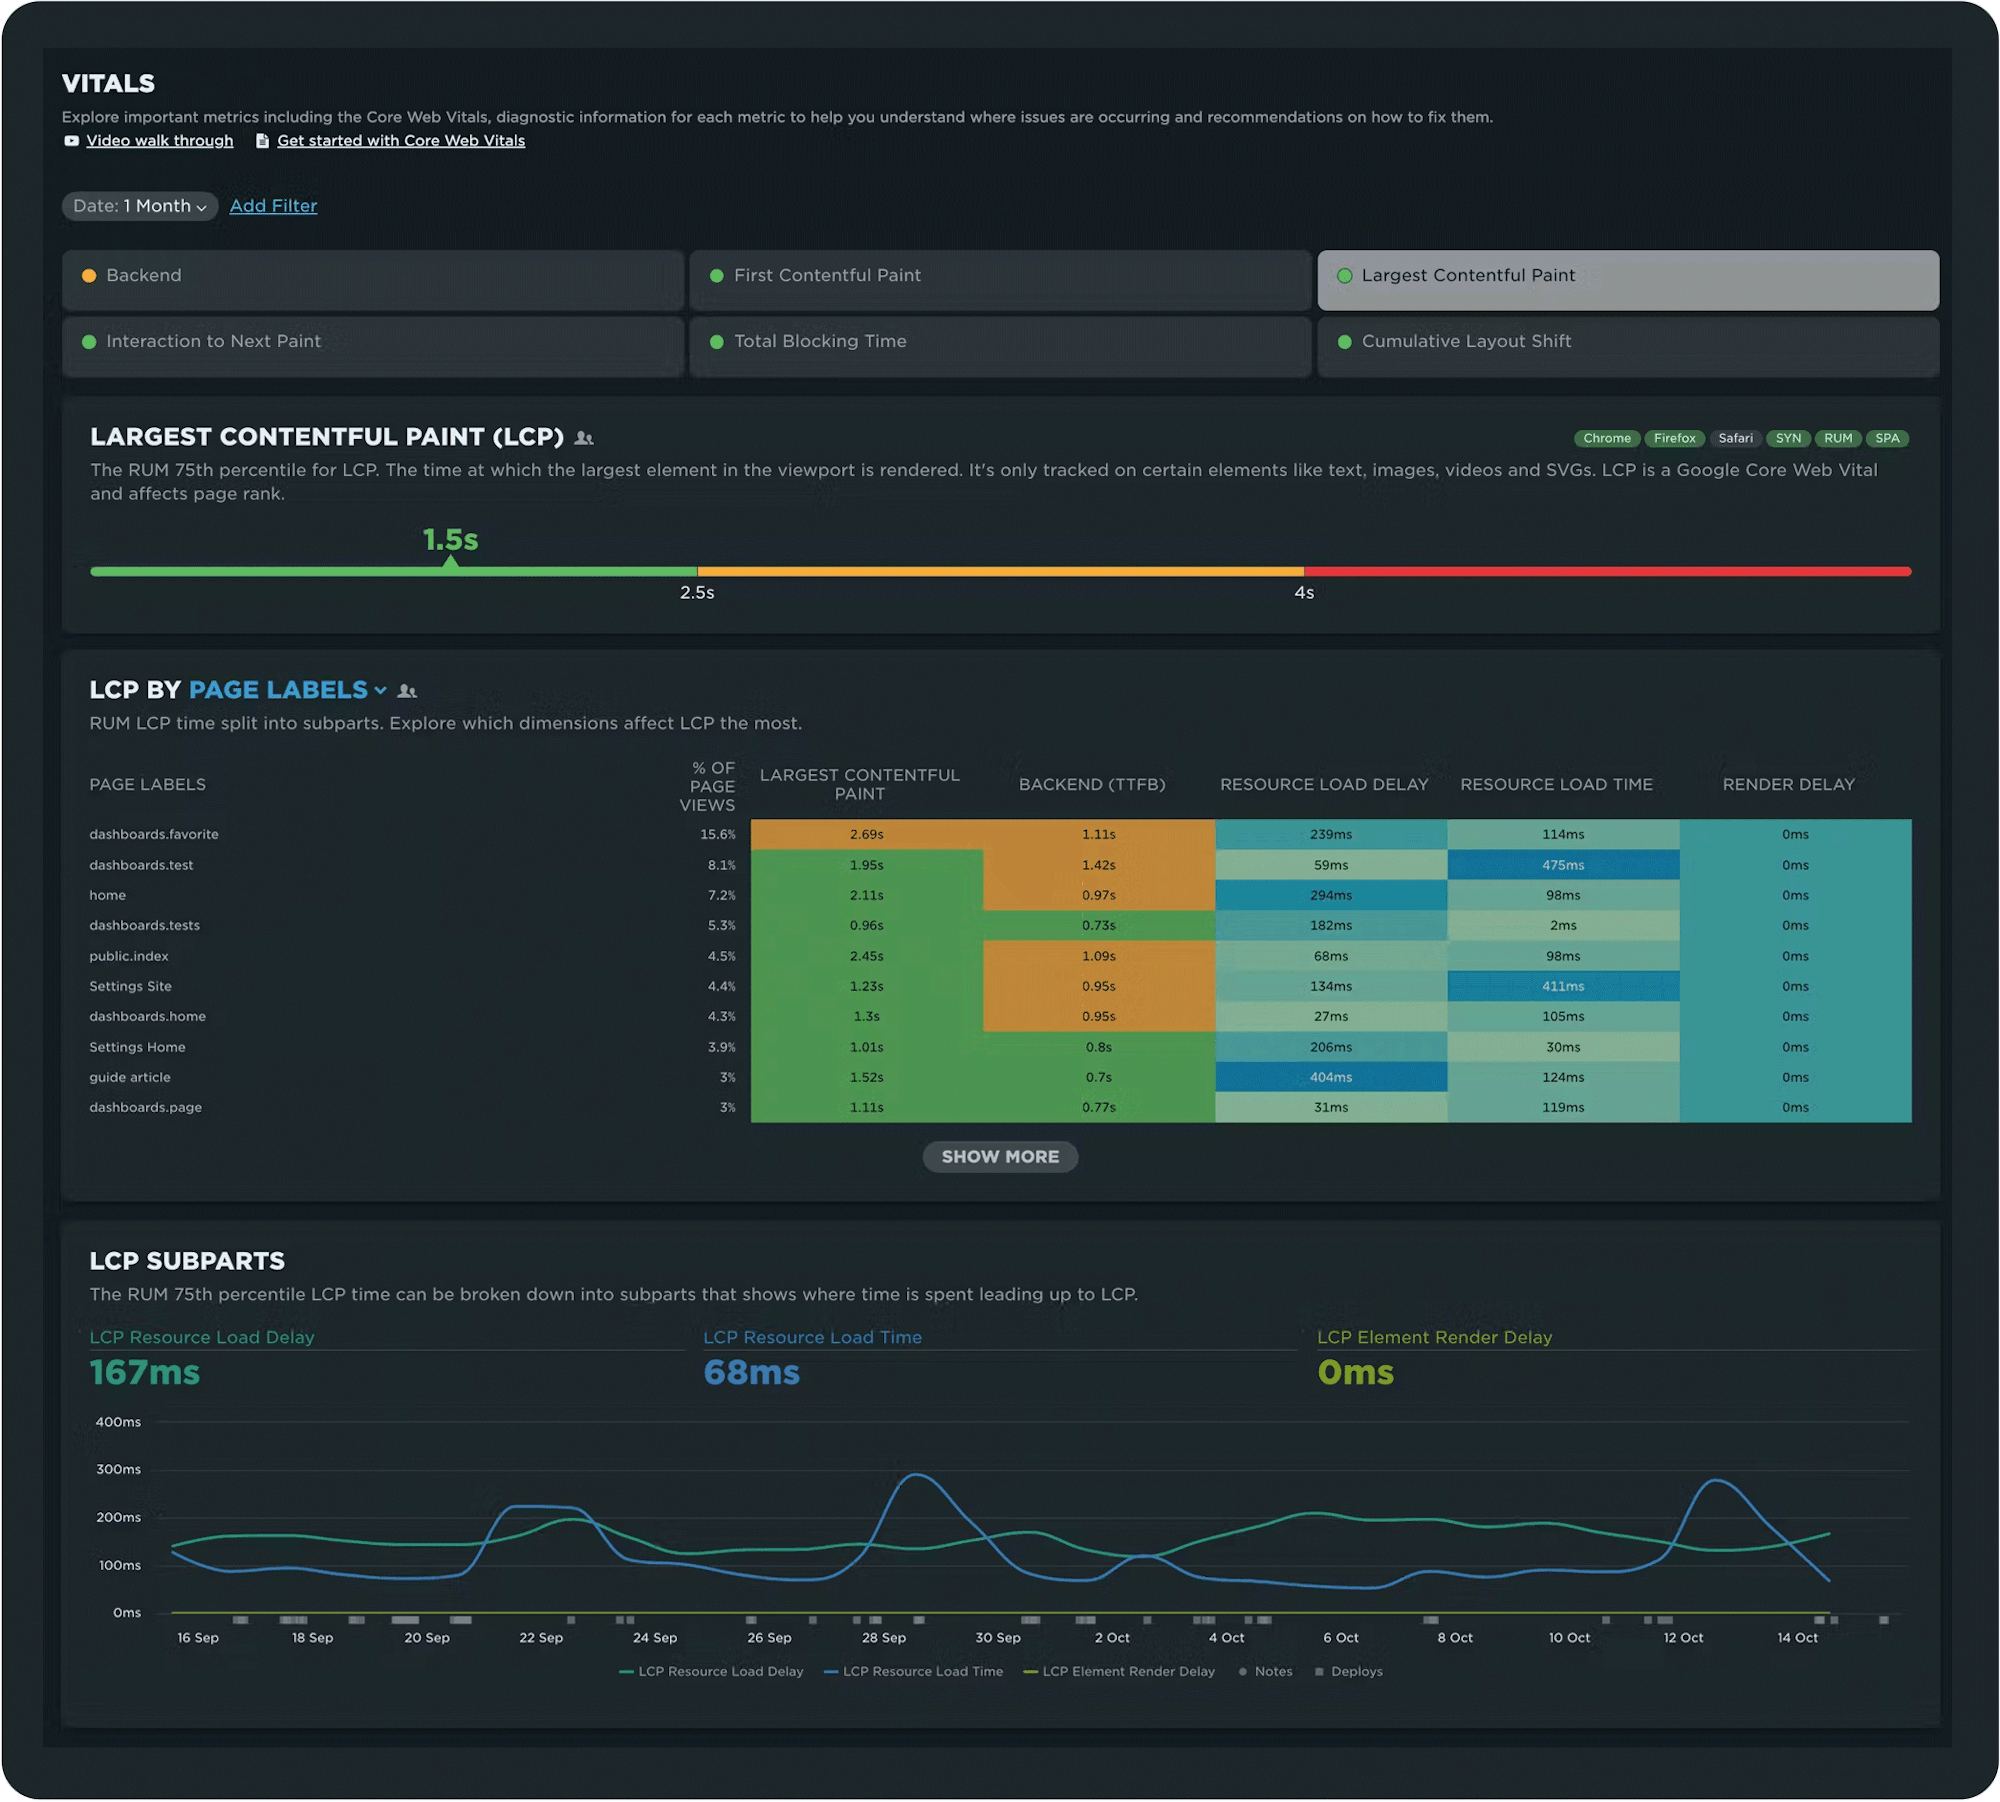
Back in September, we gave the Vitals dashboard a complete refresh. We made it easier to filter metrics across page groups and to easily see LCP and INP subparts. We also added Backend Time and First Contentful Paint (FCP) to the Vitals dashboard, and we continue to show Total Blocking Time (TBT).
These three metrics tell us a lot about potential causes of a poor user experience:
- Backend Time isn't always a black box. RUM can tell you where that time is being spent, whether its network related or due to CDN or origin issues.
- First Contentful Paint tells us when the page begins to render and effectively become consumable by an end user.
- Total Blocking Time gives us clues around CPU-intensive tasks that block rendering and interactivity with the page.
Focusing on Largest Contentful Paint (LCP), here's a walkthrough of how to leverage your Vitals dashboard to find and fix issues with your Vitals.
New RUM filters
We delivered a plethora of new RUM filters this year...
Delivery type
The delivery type of a page indicates how it was delivered to the browser. There are now three possible values:
- Cache – Page was delivered from the browser's cache, which means the browser did not make a network request for that page
- Navigational prefetch – Page came from the in-memory cache, via the Speculation Rules API
- Other – This delivery type is when none of the other delivery types applies
Note that delivery type is only supported in Chromium-based browsers.
Navigation type
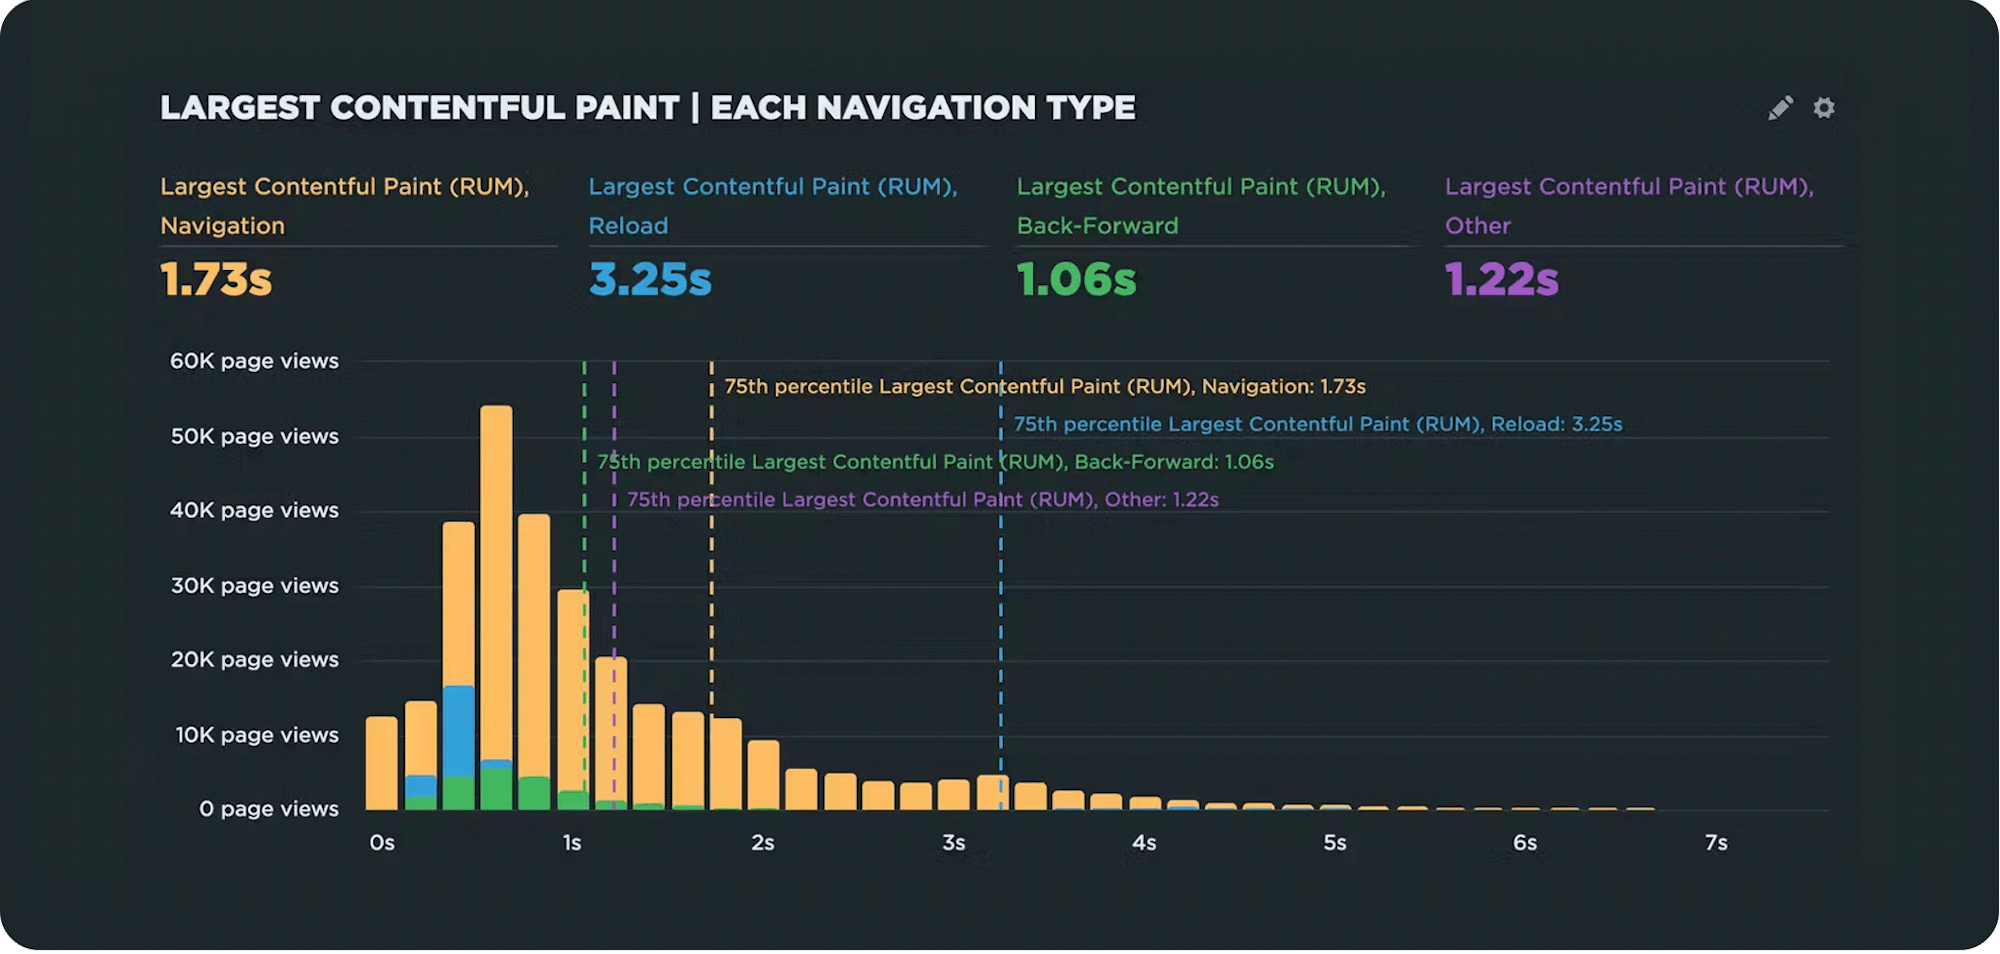
Not all navigations are created equal. We released a filter in RUM that allows you to explore navigation types. You can find navigation types in the filters of your RUM and Favorites dashboards.
These filters allow you to track:
- Navigation – Full-page navigation
- Reload – Page is reloaded from the browser history
- Back-forward navigation – Page navigation using back/forward navigation (also known as bfcache navigation) controls
- Other – All other navigations
Page attribute
Another useful filter that we added is for something we refer to as page attributes. This goes a step further in explaining the different types of navigations – both visible and hidden from the end user.
Page attributes are extremely useful when looking at pages that have unique performance characteristics, such as:
- Page was a soft navigation – When implementing RUM for a SPA, you can use this attribute to compare initial page loads/hard navigations to SPA/soft navigations.
- Page visibility was hidden – For pages that are loaded in a hidden state, such as when you open a link in a background tab for viewing later, the performance can vary greatly given the browsers ability to mitigate resource consumption in an effort to preserve the user experience.
- Page was prerendered – Prerendering can happen automagically in the browser or by using the Speculation Rules API . When this occurs, pages that are activated appear to load instantaneously and have unique characteristics compared to other types of navigations. For example, in SpeedCurve, prerendered pages will have a value of '0' for most metrics.
- Page was restored from back-forward cache – The bfcache essentially stores the full page in memory when navigating away from the page. This browser optimization has the effect of instantaneous page loads when a user is navigating back (or forward) to a previously viewed page.
These filters are super helpful for diagnosing all kinds of pain points. For example, here's how to use these filters to diagnose rendering issues with the bfcache.
Geographic region
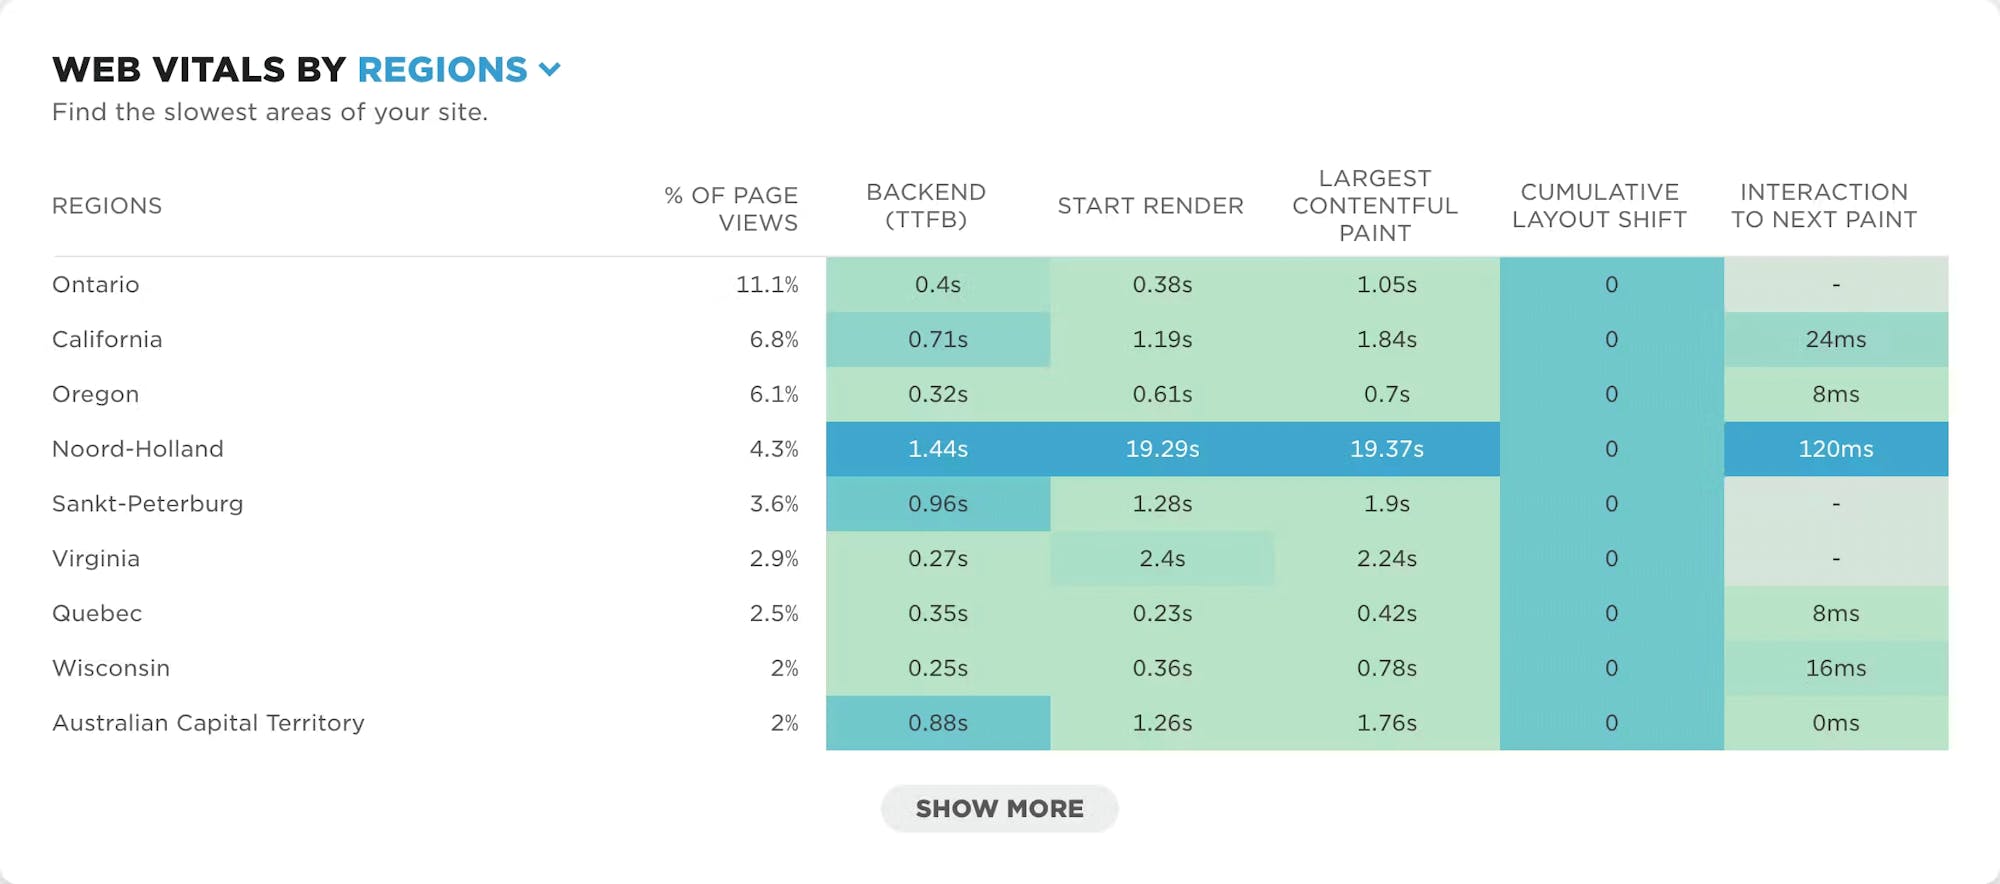
We now record users' geographic region, also known as country subdivision. This enables you to dive deeper into how your users are spread around the world. For example, you can filter Core Web Vitals by region, or find regions with the most traffic.
Improved how we collect RUM data
Last summer, while we were adding more diagnostics for Core Web Vitals, we re-implemented our RUM pipeline using Fastly's edge compute. Now performance metrics are captured for longer and beacons are sent at the earliest of 60 seconds after page load starts, or when the visitor leaves the page (if that happens sooner).
Sending the beacon later has a number of benefits, both now and down the road:
- Improves the accuracy of the metrics we capture for you
- Allows us to simplify our RUM processing pipeline
- Made it easier to implement attribution for INP and LCP
- Smooths the way for adding other features we have planned for the future
That sounds like a win for everyone!
13 months of RUM
Not only have we improved the quality of our RUM data, we've also increased the quantity. Previously, your Synthetic data was retained for 13 months and your RUM data was retained for 3 months. We've expanded RUM data retention to match Synthetic.
What does this longer retention period let you do? Among other things:
- See year-over-year changes in your metrics, including Core Web Vitals
- Bookmark and compare RUM sessions over longer time periods
- Trend metrics and compare time periods
Unified dashboard filters
SpeedCurve is now eleven years old. One of the things we love about our product is how it's evolved over time. However, in some cases, parts of our UI didn't come along for the ride. This was the case with our dashboard filters. This has been a nagging 'to-do' that we've finally checked off our list, courtesy of our awesome dev team.
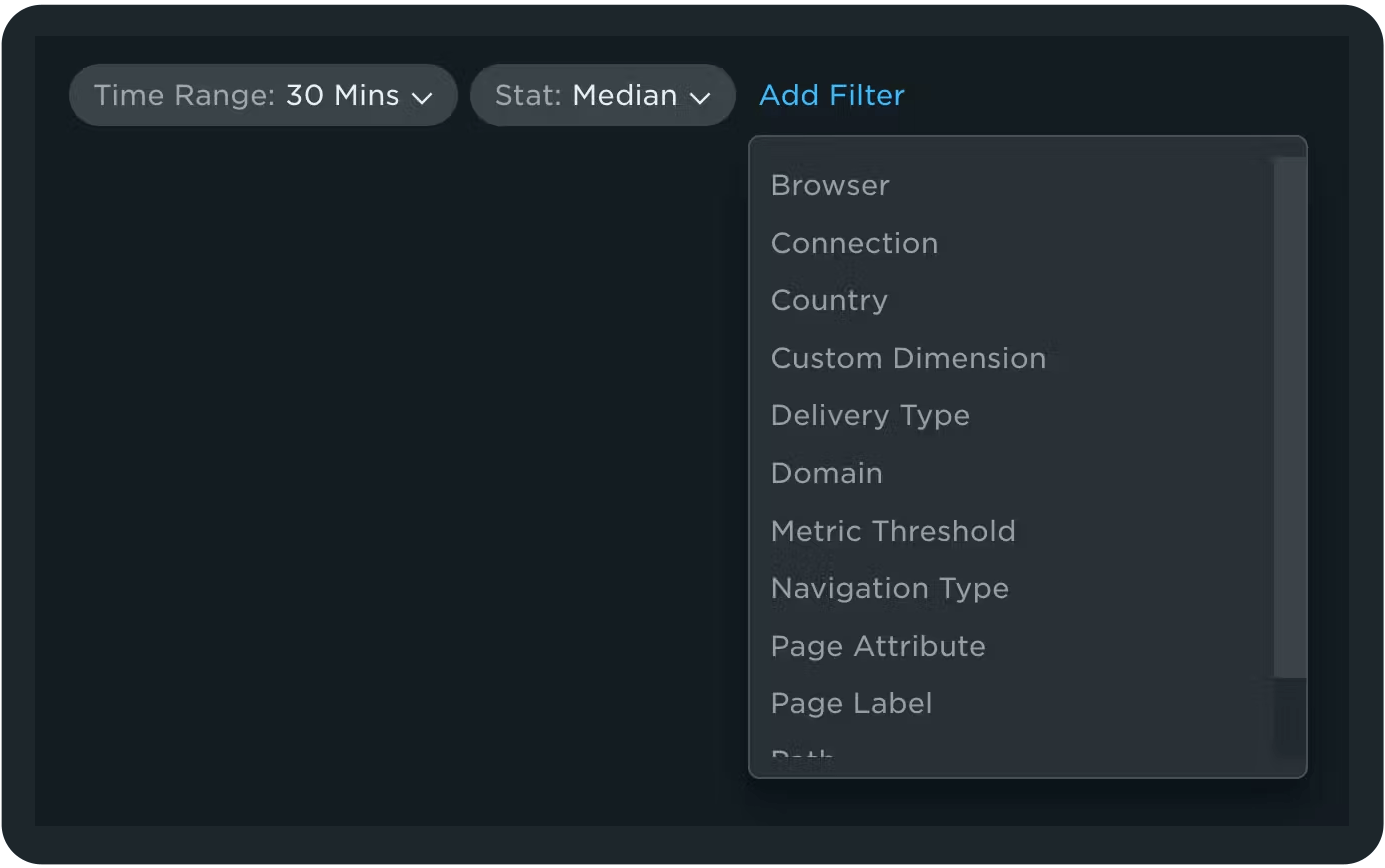
You'll find that filters now work the same way across ALL of your dashboards. As an extra bonus, you'll find more options available on most dashboards, including Favorites.
On-demand synthetic testing
By popular demand, we've made some important changes to on-demand testing:
- Updated 'Test Now' options – These include site testing and custom URL (adhoc) testing.
- View your tests – You can find your test(s) in the Synthetic Tests dashboard, where you'll be routed after starting them (unless tests are grouped as a deployment). Clicking on any of the tests will take you to the Test Details dashboard.
- Group on-demand tests as a deploy – When you select 'Group tests as a Deploy', you have the option to add a name and description for the deploy. The deploy will be marked on your charts and the test(s) will be found in the Deployments dashboard, where you'll be routed after they are submitted.
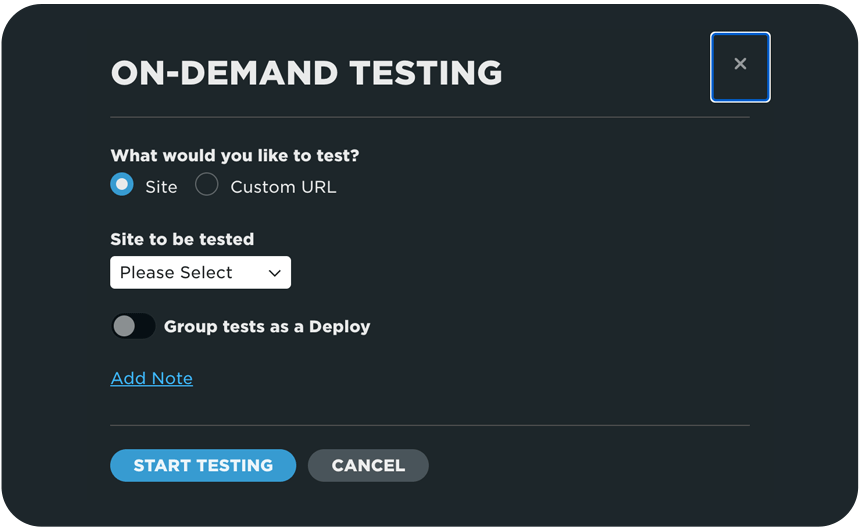
See an in-depth walkthrough: How to test a site on demand
Evergreen browser test profiles
We've introduced "evergreen" browsers to your Synthetic test settings. These browser profiles don't reference specific emulated hardware or a particular browser. They're intended to be a great place to start your web performance testing and provide long-lived profiles with names that don't age. We will periodically update these profiles as web performance trends change.
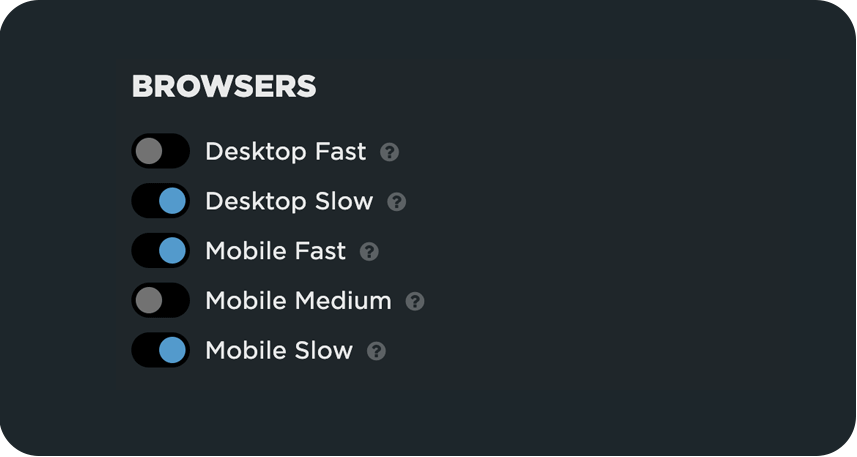
If you haven't already done this, we encourage you to switch your existing testing to these new browsers. You can also recreate any of the old browser profiles if you need them by creating a custom browser profile and referencing the old emulated devices.
We healed 30+ paper cuts!
We all love big showy features, and this year we've released our share of those. But sometimes it's the small stuff that can make a big difference.
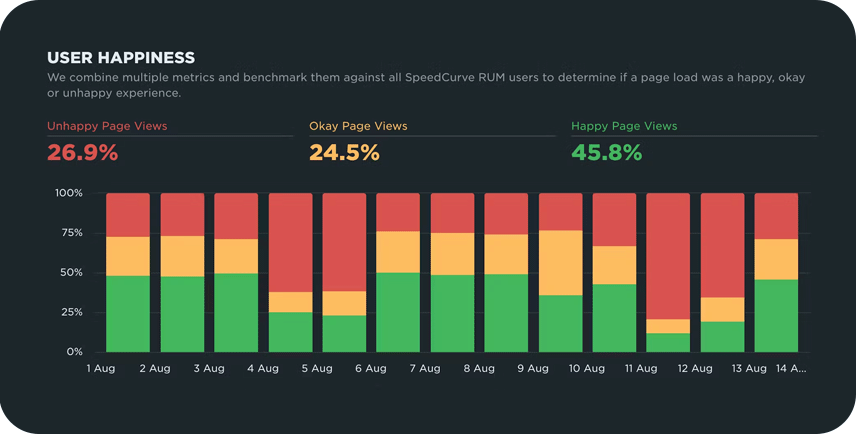
A few months ago, we looked at our backlog of smaller requests from our customers – which we labelled "paper cuts" – and decided to dedicate time to tackle them.
These include:
- Exciting new chart types for Core Web Vitals and User Happiness (shown above)
- Usability improvements
- Create a set of tests for one or multiple sites or custom URLs
- Test directly from your site settings when saving changes
- Better messaging for test failures
- And more!
We hope these updates have made your performance and UX monitoring easier!
Expanded our coaching services
Since we ramped up our coaching services, these are the most common goals and concerns we've heard when we talk to people:
- Staying compliant with Google's thresholds for Core Web Vitals
- Minimizing and fighting regressions
- Improving search rank, conversions, and bounce rate
We're super proud of our recent coaching successes, including:
- Decreased Largest Contentful Paint on product images from over 3 seconds to under 2 seconds for a major US retailer
- Reduced Interaction to Next Paint from over 500ms to under 200ms for a national French news site
- Improved Cumulative Layout Shift so 97% of visitors had a good experience for a global hardware and IT services company
How can we help you? Our team includes some of the most experienced people in web performance – Steve Souders, Tammy Everts, me, Andy Davies, and Mark Zeman (from left to right below). We've started global conferences, written books, taught courses, run design agencies, and improved user engagement and conversion rates for all the big brands.

We care about making the web faster, and we want to help you. Contact us at support@speedcurve.com to learn how we can help you meet your performance goals in 2025.
Looking ahead to 2025
We love our industry's current trajectory. Talking to customers, browser vendors, and other monitoring providers, it feels like we're all aligned on some of the same goals:
- Get even more nuanced, actionable data from RUM
- Think outside the Core Web Vitals box
- Make our tools easy for a broader audience to use (We see you, marketing, SEO, and product management folks!)
- Continue the quest for iOS support of modern metrics
As always, we love your thoughts and feedback. What do you need in the year ahead? What are your biggest performance challenges? What are you most excited about? Send us a note at support@speedcurve.com!
